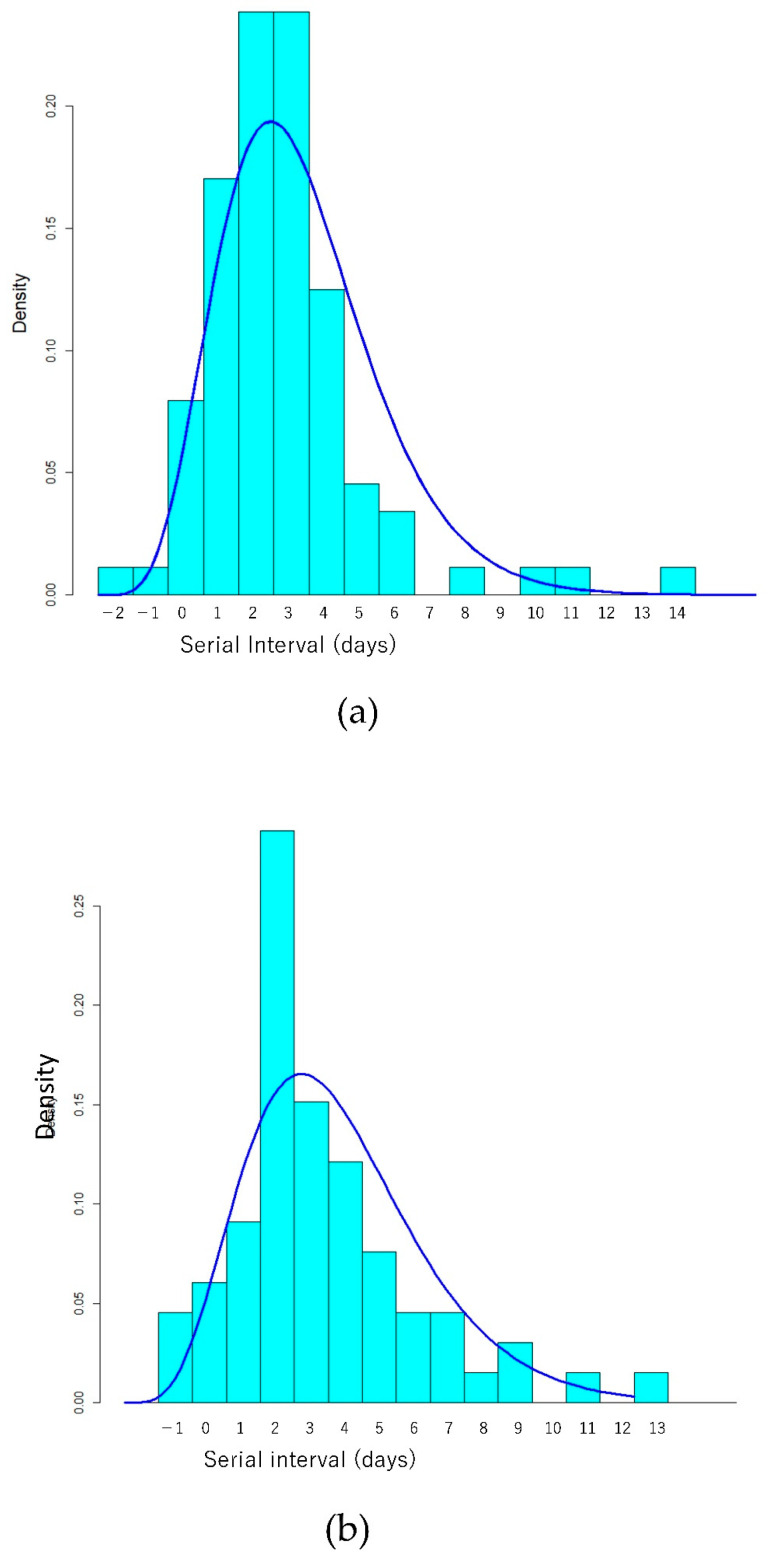
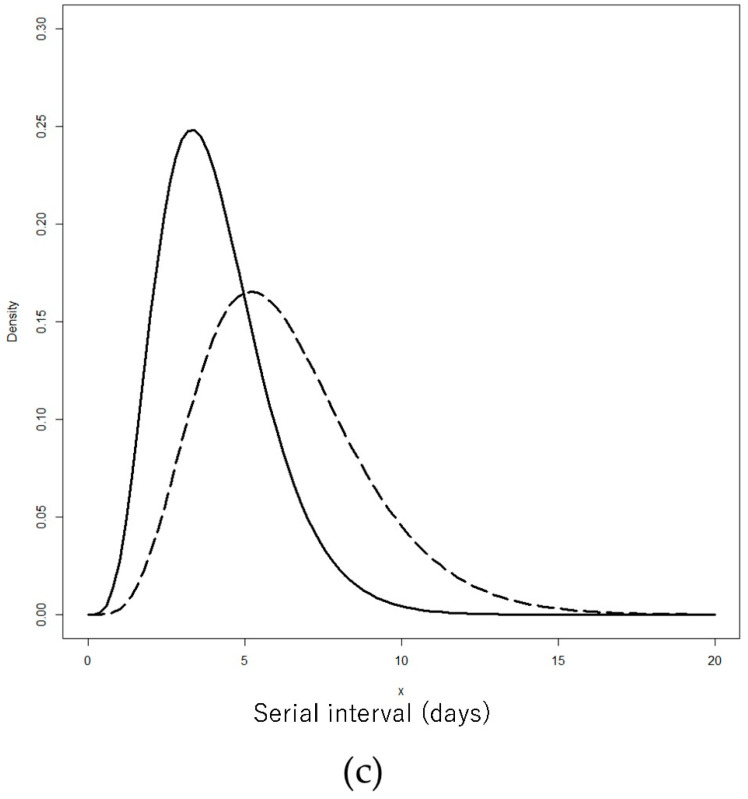
Figure 2.
Histogram and probability density of estimated Gamma distribution of serial interval for (a) Delta and (b) non-Delta cases. (c) Comparison of probability density of estimated Gamma distribution of shifted (adding 3 days to data) serial interval between Delta (solid line) and non-Delta cases (dashed line).


