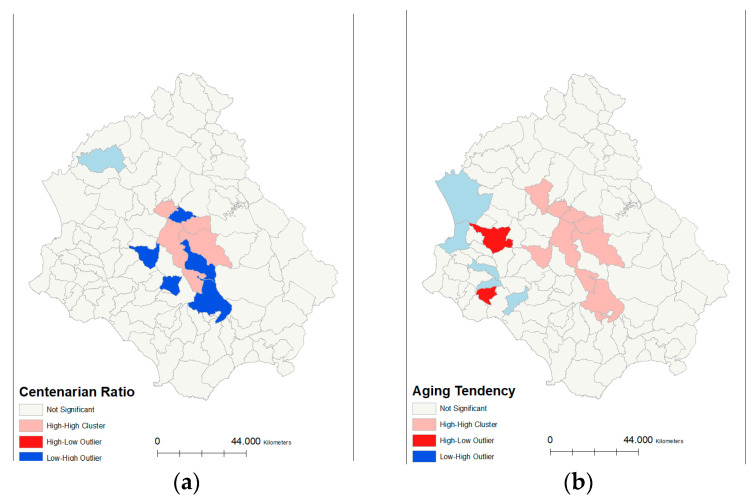
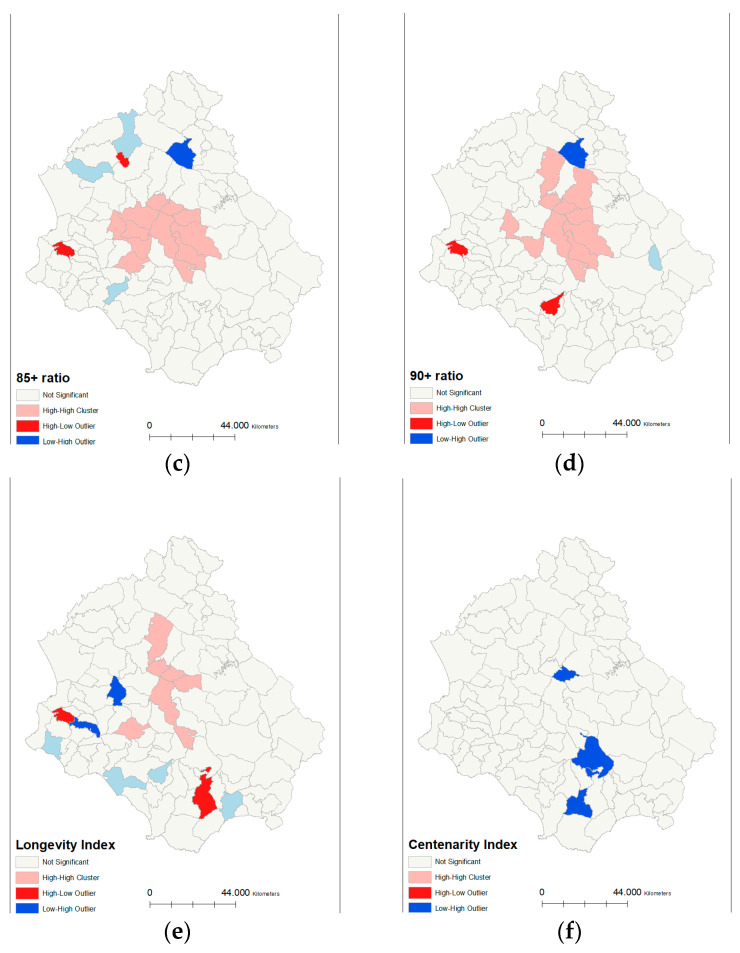
Figure 3.
Local spatial distribution (Anselin local Moran’s I) maps of the cluster/outlier type for longevity indicators in Cilento municipalities. Note: (a) maps of the cluster/outlier type for Centenarian ratio; (b) maps of the cluster/outlier type for Aging tendency; (c) maps of the cluster/outlier type for 85+ ratio; (d) maps of the cluster/outlier type for 90+ ratio; (e) maps of the cluster/outlier type for Longevity index; (f) maps of the cluster/outlier type for Centenarity index.


