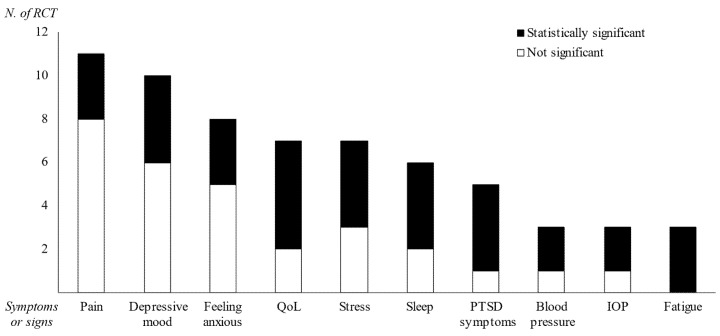
Figure 2.
Graphical display of the primary outcomes of the RCTs. Regarding only primary measurements, the 10 most frequently assessed symptoms or signs (conducted in ≥3 RCTs) are shown. The black square (■) indicates the number of RCTs in which the intervention achieved statistical significance compared to the control (p < 0.05 or Cohen’s d > 0.5) for the primary outcome assessment.

