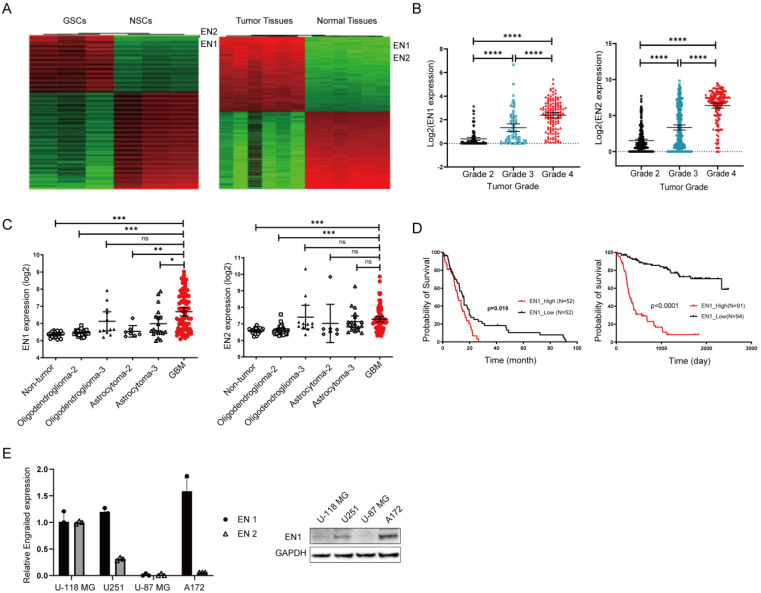
Figure 1.
Elevated EN expression is associated with glioma cancer progression. (A) RNA-seq results for mouse glioma stem cells lines vs. neural stem cells (left) and for mouse brain tumor tissues vs. normal brain tissues (right). (B) The expression of EN1 (left) and EN2 (right) in glioma samples from TCGA database. Black, blue and red color is for Grade 2, 3 and 4 respectively. (C) Analysis using the Henry Ford Hospital dataset, showing correlation between the EN1 (left) and EN2 (right) gene expression levels and glioma patient tumor grade (○ for Non-tumor, □ and ▲ for Oligodendroglioma-2 and 3, ◊ and ∆ for Asreocytoma-2 and 3, red ● for GBM). (D) Correlation between glioma patient survival and the EN1 expression level from TCGA glioblastoma database (left) and the Chinese Glioma genome Atlas gliomas database (right). (E) For the indicated glioma cell lines, Engrailed 1 expression assessed by qPCR (left) and Engrailed 1 accumulation assessed by immunoblotting (right). * p < 0.05, ** p < 0.01, *** p < 0.001, **** p < 0.0001 and ns (no significant) according to Student’s t-test.

