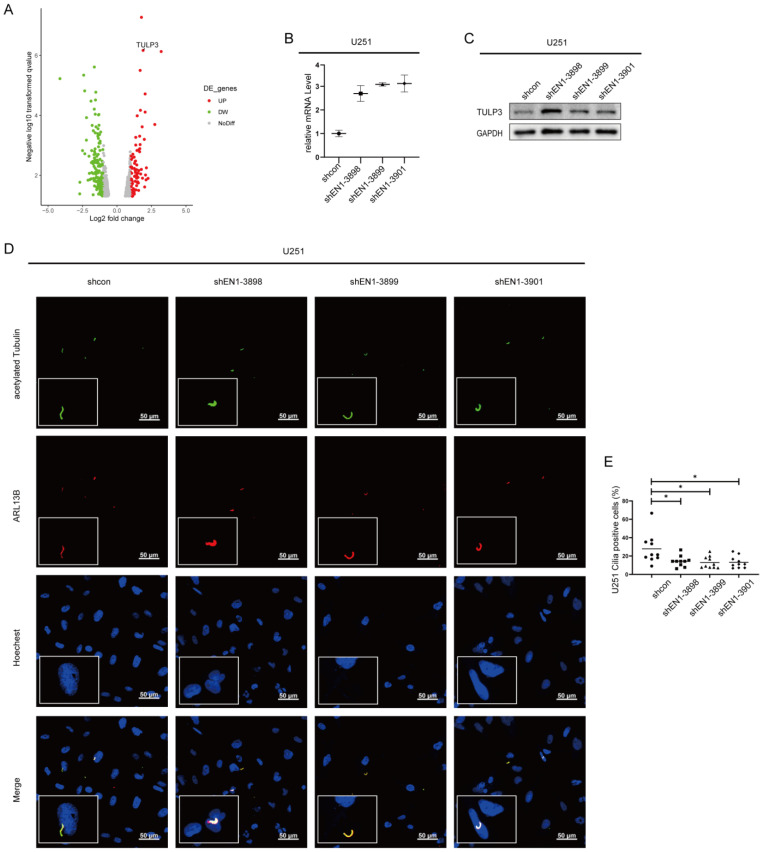
Figure 5.
Silencing EN1 upregulates the expression of TULP3. (A) Volcano plot of differentially expressed genes (DEGs) in EN1 knockdown glioma cells (vs. scramble control cells). qPCR (B) and immunoblotting (C) confirmed that EN1 knockdown glioma cells have elevated TULP3. (D) Staining of glioma cells with antibodies against ARL13B and acetylated tubulin. (E) EN1 knockdown significantly decreased the number of primary cilia. Scale bar: 50 µm. Data are presented as the mean from three independent experiments (● for shcon, ■ for shEN1-3898, ▲ for shEN1-3899, ◆ for shEN1-3901). * p < 0.05 according to Student’s t-test.

