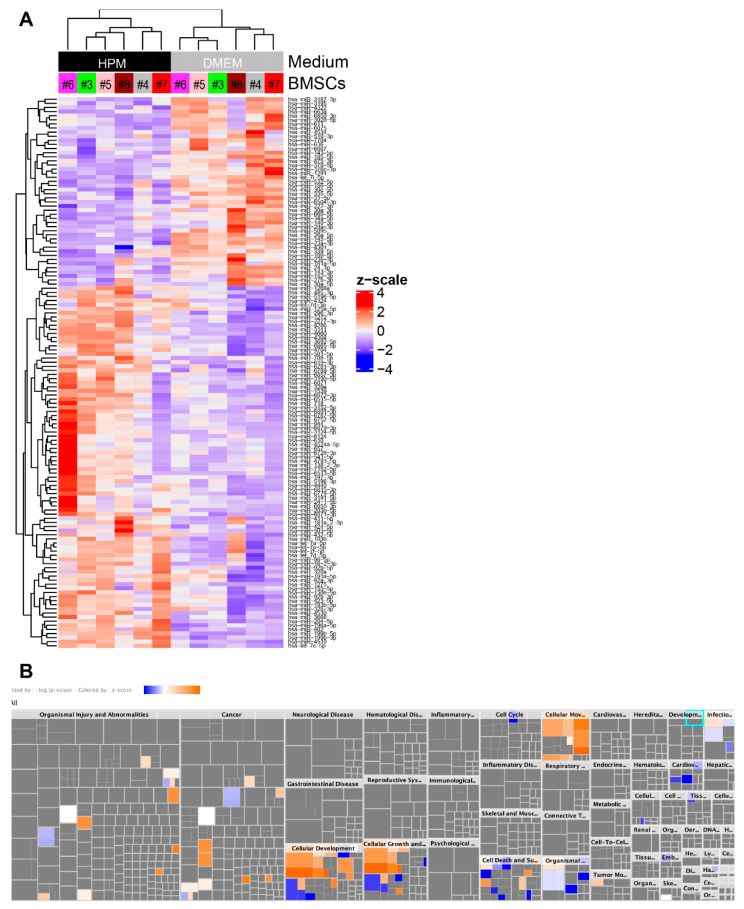
Figure 7.
Differential gene expression analysis and ingenuity pathway analysis. (A) Heat map and hierarchical clustering analysis shows miRNAs upregulated (88 miRNAs) and downregulated (46 miRNAs) in EVs from BMSCs cultured in HPM compared to those from BMSCs cultured in DMEM + 10%FBS. (B) Ingenuity pathway analysis for the diseases & functions of 88 upregulated and 46 downregulated miRNAs identified in (A).

