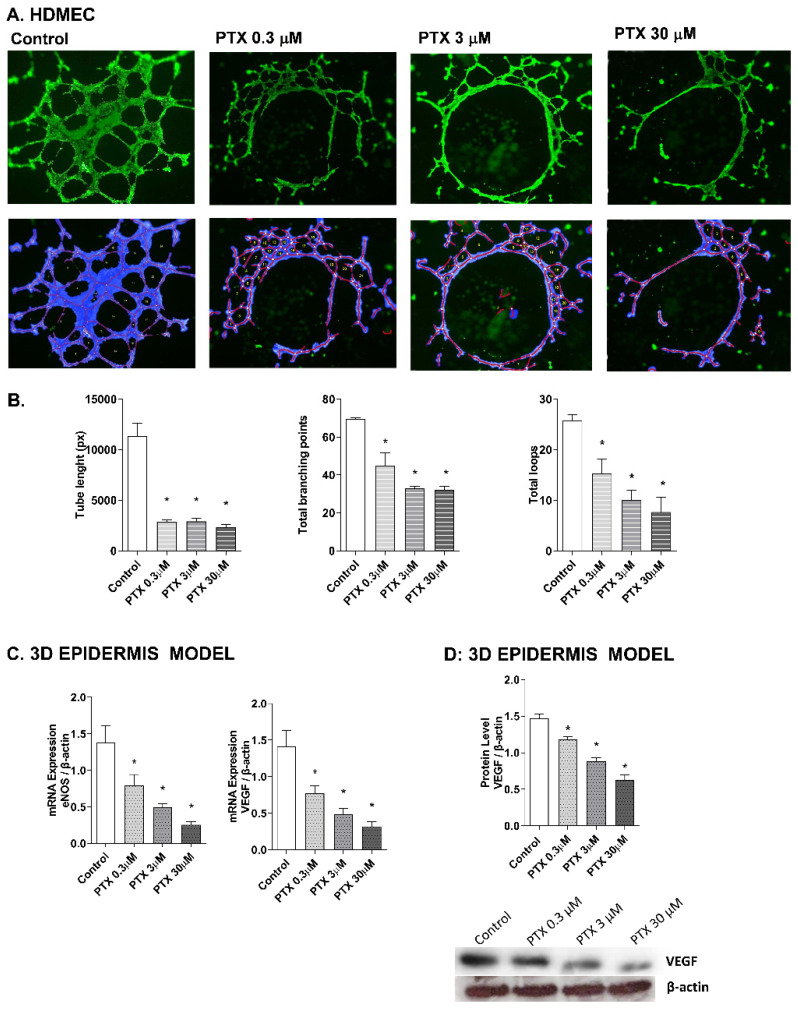
Figure 5.
Paclitaxel inhibits endothelial tube formation in human dermal microvascular endothelial cells (HDMEC) and reduces eNOS and VEGF expression in the 3D epidermis. (A) HDMEC were incubated with increasing paclitaxel concentrations for 16 h, and angiogenesis was analyzed by the endothelial tube formation assay. Representative images of the tubular structures formed are displayed. Top images show the green, fluorescent calcein staining. Bottom images show the overlay generated by WimTubeTM software (Onimagin Technologies SCA, Córdoba, Spain), in which each color represents a structure: blue represents the covered area, red the tubes, white the branching points and yellow the number of loops. (B) Quantitative evaluation of morphological features of the capillary-like network structure. Tube length, total branching points and total loops after treating HDMEC with increasing paclitaxel concentrations. The analysis was performed using WimTubeTM software (Onimagin Technologies SCA, Córdoba, Spain). (C) 3D epidermal model tissues were incubated for 24 h with increasing paclitaxel concentrations. eNOS and VEGF mRNA levels were measured by real-time PCR. Data are expressed as 2−ΔCt. (D) In vitro 3D epidermal model was incubated for 24 h with increasing paclitaxel concentrations. VEGF protein levels were analyzed by Western blotting. Quantification was performed by densitometry and normalized to β-actin. Results are expressed as mean ± standard deviation of three independent experiments (n = 3). Multiple comparisons analysis of variance (ANOVA) was followed by the post hoc Bonferroni test. * p < 0.05 vs. control. PTX: paclitaxel.

