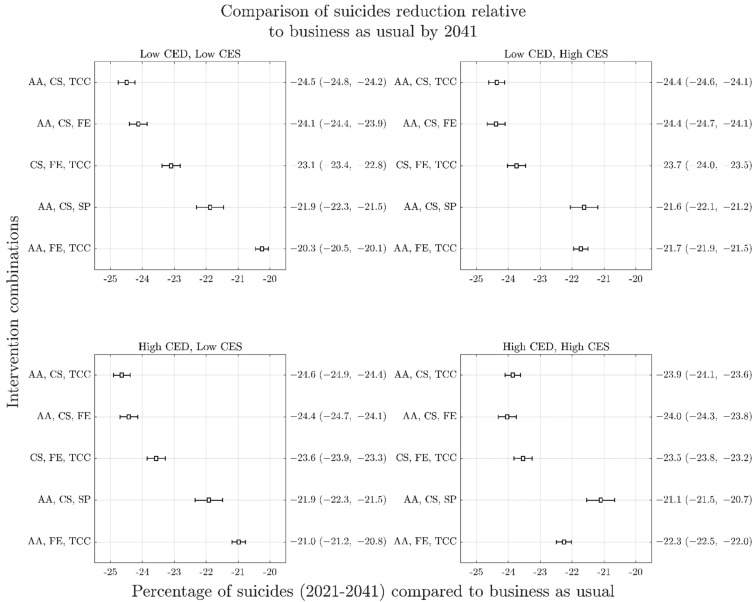
Figure 3.
Forest plots arising from sensitivity analyses of reduction in cumulative suicide deaths (2021–2041) as a result of top performing intervention combinations across the four COVID-19 mental health scenarios. Panels represent different COVID-19 scenarios: top left, short duration and low impact (Scenario A); top right, short duration and high impact (Scenario B); bottom left, long duration and low impact (Scenario C); bottom right; long duration and high impact (Scenario D). The y-axis of each panel presents the mean percent reduction in cumulative suicides against the baseline (business as usual) for each intervention combination with uncertainty intervals in brackets. Overlapping 95% intervals indicate possible ambiguity of rankings within each COVID-19 mental health scenario, relating to the uncertainty in intervention effect sizes and services capacity growth rates. Similarity of possible rankings between scenarios is indicative that uncertainty about the effects of COVID-19 on mental health do not change recommendations about optimal intervention investments. AA is post-suicide attempt aftercare; CS is community support programs to increase community connectedness; SP is safety planning; FE is family education and support; TCC is technology-enabled care coordination.

