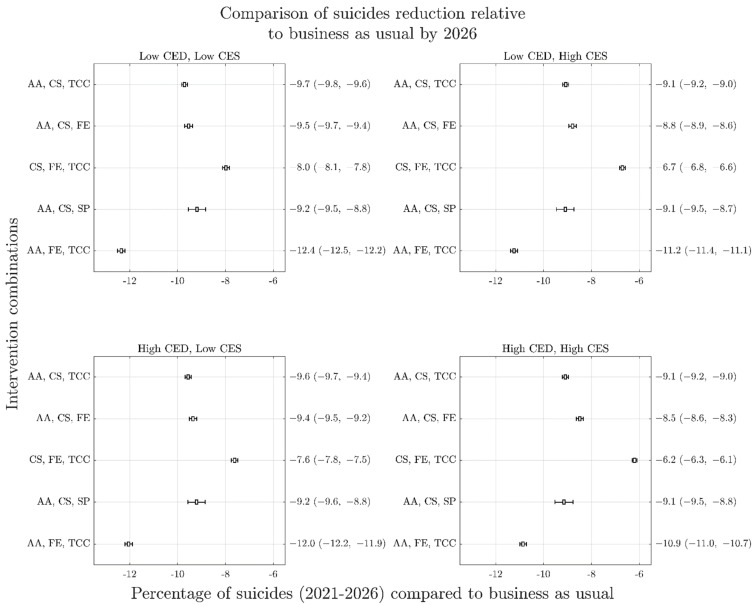
Figure 5.
Forest plots similar to Figure 3 for percent reduction in cumulative suicides over the period 2021–2026 as a result of top performing intervention combinations. Note substantially different performance rankings from Figure 3 but similarity of rankings across COVID-19 mental health scenarios. Panels represent different COVID-19 scenarios (A–D) as per previous figures. AA is post-suicide attempt aftercare; CS is community support programs to increase community connectedness; SP is safety planning; FE is family education and support; TCC is technology-enabled care coordination.

