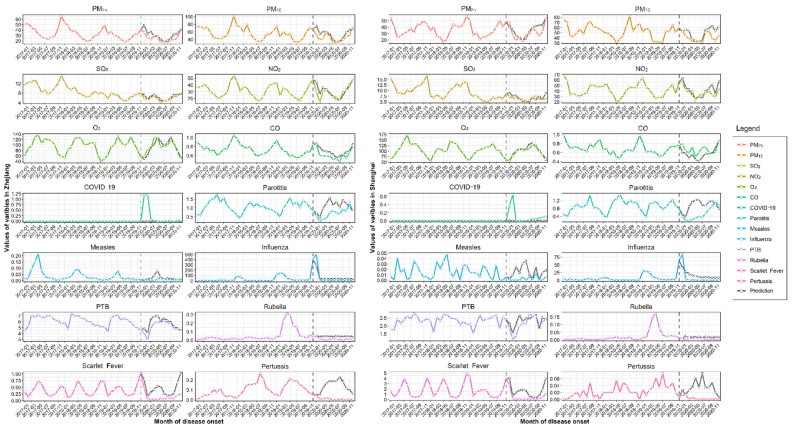
Figure 8.
Actual monthly concentrations of six air pollutants and eight respiratory infectious diseases in Zhejiang and Shanghai from 2017–2020 and hypothetical values for 2020 in the absence of COVID-19. Note: The horizontal axis depicts the months. The concentration of pollutants—SO2 (μg/m3), NO2 (μg/m3), CO (mg/m3), O3 (μg/m3), PM2.5 (μg/m3), and PM10 (μg/m3)—are plotted along the six vertical axes of the first six graphs, and incidence (per 100,000) is plotted along the vertical axes of the last eight graphs. The black lines represent the assumed values of the diseases and pollutants, and the colored lines represent the real values.

