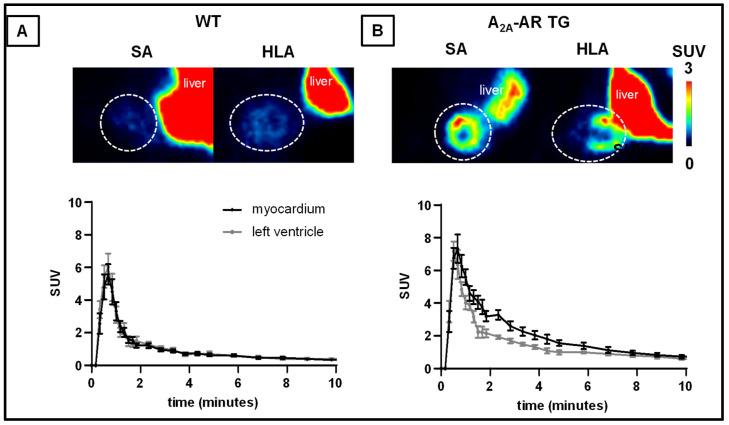
Figure 5.
In vivo evaluation of the [18F]FLUDA biodistribution in the abdominal heart region by PET imaging. Images show the cardiac planes averaged from 1 to 10 min p.i. in the short axis (SA) and horizontal long axis (HLA) of averaged time frame between three and ten minutes after administration of [18F]FLUDA in (A) WT and (B) A2A-AR TG. The heart region is marked with a dotted circle. Mice were pre-treated with vehicle 10 min prior to radiotracer application. Lookup-table decodes for the mean activity concentration given in standardised uptake values (SUV).

