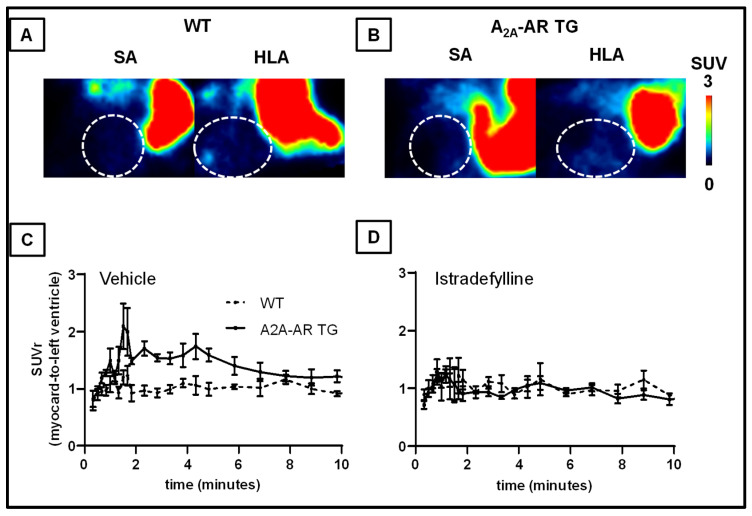
Figure 6.
[18F]FLUDA time-activity curves (TACs) in the myocardium and the left ventricle (blood compartment). Values are represented as mean standardised uptake values (SUV ± S.E.M.) in the initial 10 min after radiotracer administration in (A) WT and (B) A2A-AR TG (n =). (C) TACs of the myocardium normalised to the blood compartment, and (D) to the muscle (SUVr ± S.E.M.); n = 6–8.

