Figure 4.
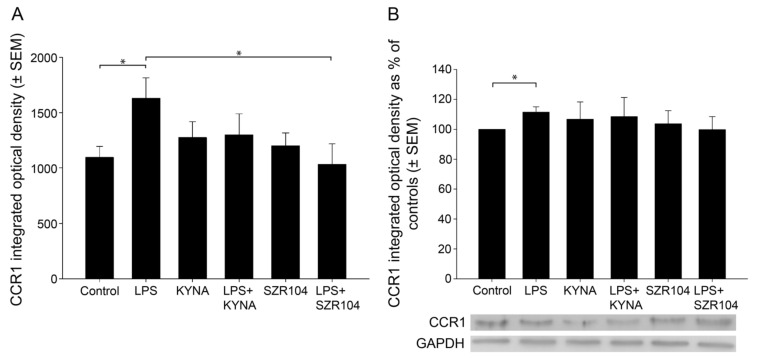
Quantitative analysis of CCR1 protein expression in unchallenged and treated microglia-enriched cultures. (A) A quantitative light microscopic microdensitometric analysis of CCR1 protein expression. The LPS challenge significantly elevated CCR1 immunoreactivity to approximately 148% of the control value in microglial cells, whereas KYNA or SZR104 alone, or the combined treatment of LPS + KYNA, did not significantly alter the amount of CCR1 immunoreactive signal compared to controls. However, LPS + SZR104-treated cultures displayed significantly lowered CCR1 levels compared to LPS-treated cultures, and they returned to levels seen in unchallenged (control) cells. Data (presented as means ± SEMs) were analyzed with the Mann–Whitney rank sum test: * p < 0.05. (B) A quantitative western blot analysis of cytoplasmic CCR1 immunoreactivity. Representative images of western blots are shown below the graph, together with the GAPDH immunoreactive bands that served as protein load control. Protein samples were collected from at least five separate cultures, electrophoresed, and then quantitatively analyzed, as described in the Materials and Methods section. CCR1 immunoreactivity significantly increased after the LPS treatment. It did not change when the cultures were treated with LPS + KYNA or LPS + SZR104. Error bars indicate integrated optical density values with the data values for each group expressed as a percentage of the control values. LPS: 20 ng/mL; KYNA: 1 µM; and SZR104: 1 µM. Integrated optical density data (presented as means ± SEMs) were analyzed with the Mann–Whitney rank sum test: * p < 0.02.

