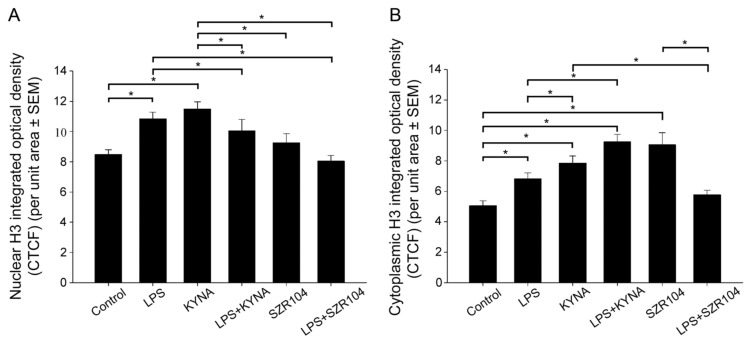
Figure 7.
Intracellular distribution of unmodified histone H3 protein immunoreactivity in the nucleus and cytoplasm of microglia in unchallenged and treated microglia-enriched cultures. Corrected total cell fluorescence (CTCF) values for the whole cell, nucleus, and cytoplasm were calculated as described in the Materials and Methods section. (A) The amount of H3 immunoreactivity rose significantly in the nucleus of LPS- and KYNA-treated microglia. SZR104 effectively decreased the amount of histone H3 after LPS treatment. (B) Except for the LPS + SZR104 treatment, all the treatments increased the amount of unmodified cytoplasmic histone H3. LPS: 20 ng/mL; KYNA: 1 µM; and SZR104: 1 µM. Data (presented as means ± SEMs) were analyzed with Kruskal–Wallis one-way ANOVA on ranks: * p < 0.05.

