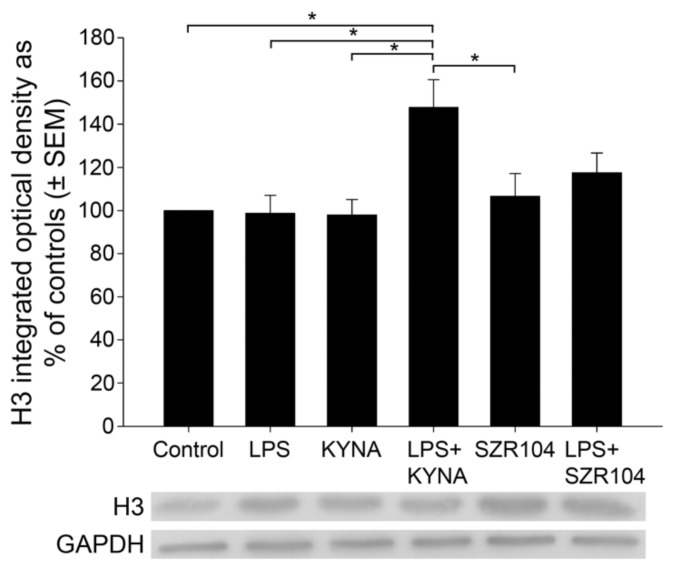
Figure 8.
Quantitative western blot analysis of the cytoplasmic histone H3 protein level in microglia-enriched cultures. Representative images of western blots are shown below the graph, together with the GAPDH immunoreactive bands that served as inner standards. Protein samples were collected from at least five separate cultures (subDIV7), electrophoresed, and quantitatively analyzed as described in the Materials and Methods section. The combined LPS + KYNA treatment induced a significant increase in histone H3 immunoreactivity when compared with that in control (unchallenged) and other treated cultures. The error bars indicate integrated optical density values with data expressed as a percentage of the control values. LPS: 20 ng/mL; KYNA: 1 µM; and SZR104: 1 µM. Data values (presented as means ± SEMs) were analyzed using ANOVA followed by pairwise multiple comparisons (Holm–Sidak method): * p < 0.05.

