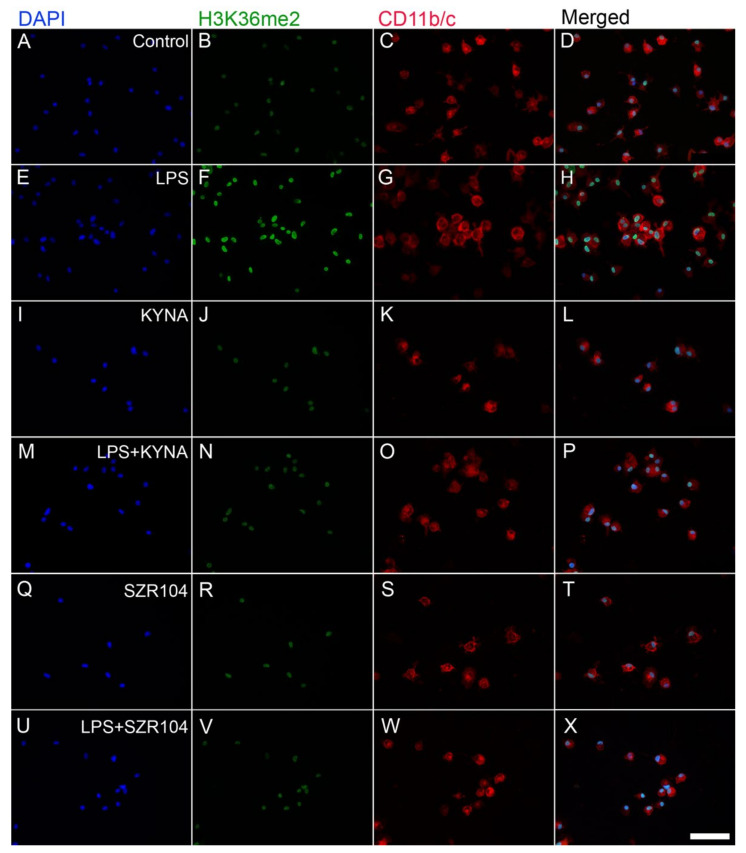
Figure 12.
Localization of H3K36me2 immunoreactivity in CD11b/c-labeled microglia in unchallenged and treated microglia-enriched cultures. Representative immunocytochemical images showing the intracellular distribution of histone H3K36me2 protein immunopositivity (green) in unstimulated (control) (A–D), LPS-challenged (E–H), KYNA-treated (I–L), LPS + KYNA-treated (M–P), SZR104-treated (Q–T), and LPS + SZR104-treated (U–X) CD11b/c-immunopositive microglial cells (red). The anti-CD11b/c antibody was used to highlight microglial cells. The very high purity of the microglial cultures is evident (DAPI vs. CD11b/c labels). Note that the LPS challenge (E–H) markedly increased H3K36me2 immunopositivity relative to that of the unchallenged control (A–D) or any other treatment (I–X). Histone H3K36me2 was detected in the nucleus. LPS: 20 ng/mL; KYNA: 1 µM; and SZR104: 1 µM. Scale bar: 75 µm.

