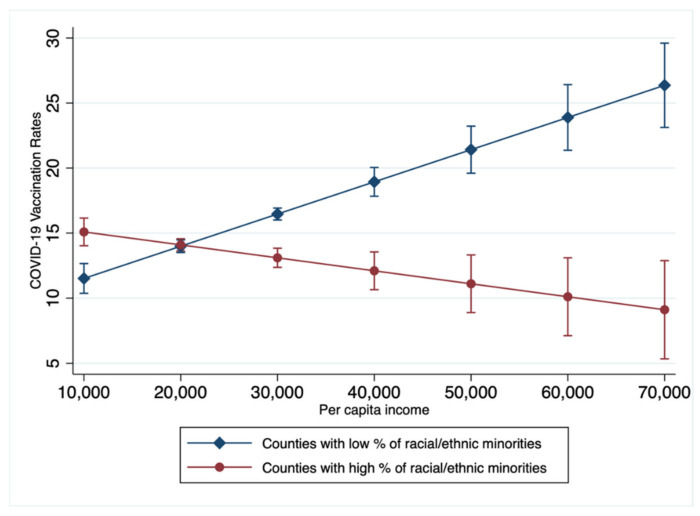
Figure 1.
Interaction effects between County-level Per Capita Income, Racial/Ethnic Minorities, and COVID-19 Vaccination Rates. Counties with low and high percent of racial/ethnic minorities: the percentage of adults who are Black, Indigenous, People of Color adults was dichotomized into the top and bottom 5% of the distribution by county-level racial/ethnic composition.

