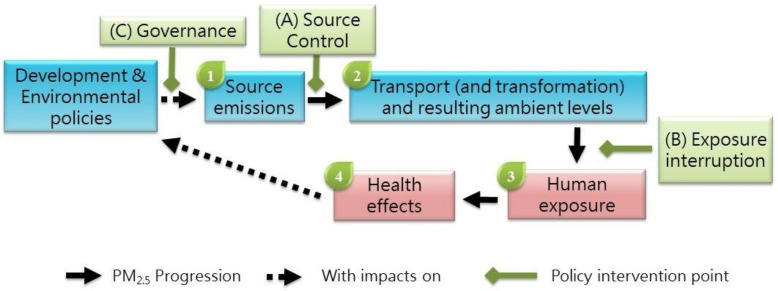
Figure 3.
Diagram of policy impacts with intervention points along the progression of PM2.5 from sources to health impacts. The intervention points (green arrows) are numbered by letters according to the order of the identified research priorities (1–4), with point A corresponding to priorities 1 and 2, point B to 3, and point C to 4. Black solid arrows indicate the PM2.5 progression from sources to health impacts. Black dash arrows indicate policies that impact or are being impacted upon.

