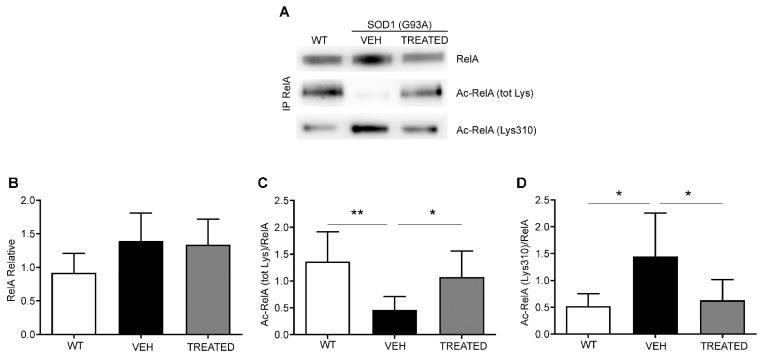
Figure 5.
Immunoprecipitation and densitometric analysis of RelA acetylation in combined sex mice: (A) Representative image of immunoprecipitation and Western blot analysis of nuclear RelA (65 kDa), total lysine acetylation of RelA (Ac-RelA (tot lys)) and acetylation of lysine 310 (Ac-RelA (lys310)); (B) Densitometric analysis shows a trend in the increase of RelA in the VEH and TREATED groups compared to the WT; (C) Ac-RelA (tot lys) acetylation was statistically reduced in the VEH group compared to the WT (p = 0.0035) and TREATED group (p = 0.0461); (D) Ac-RelA (Lys 310) was significantly increased in the VEH group compared to the WT (p = 0.0216), and to the TREATED group (p = 0.0439). (n = 6 WT, 10 VEH, 12 TREATED) Results were analyzed by one-way ANOVA, followed by Tukey’s multiple comparisons test. Graphs are shown as mean ± SEM. * p < 0.05; ** p < 0.005. Full length blots are shown in Supplementary Materials in Supplementary Data 2 Figure S7.

