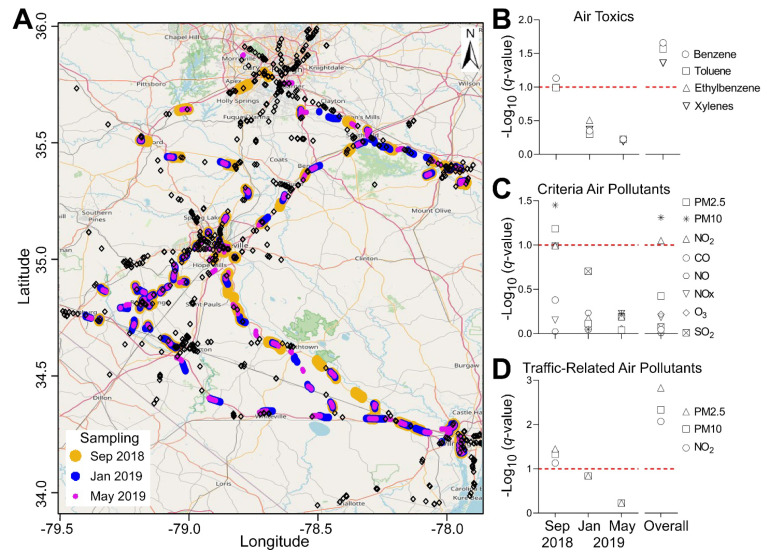
Figure 4.
Spatial association between each concentration of each pollutant evaluated in this study and fueling stations at each of the sampling periods. (A) Map showing sampling points for all three time periods (see color map as an inset) in relation to the fueling station locations (black diamonds). (B–D) Significance of the spatial association (q-values) between air pollutants and fueling stations. Horizontal dotted line shows false discovery rate of 10%. (B) BTEX, (C) criteria air pollutants, and (D) traffic-related criteria air pollutants.

