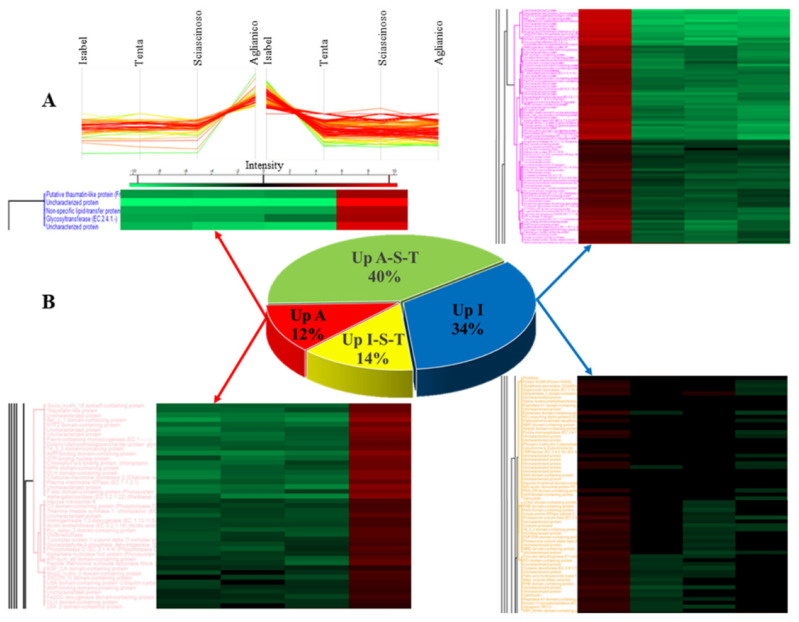
Figure 4.
(A) Profile plots of four representative selected clusters (two clusters up regulated in Isabel and two cluster in Aglianico) showing distinct behaviour with respect to the four red grapes and (B) details of the heat maps relevant to gene products associated with the categories “Up-Aglianico” and “Up-Isabel”.

