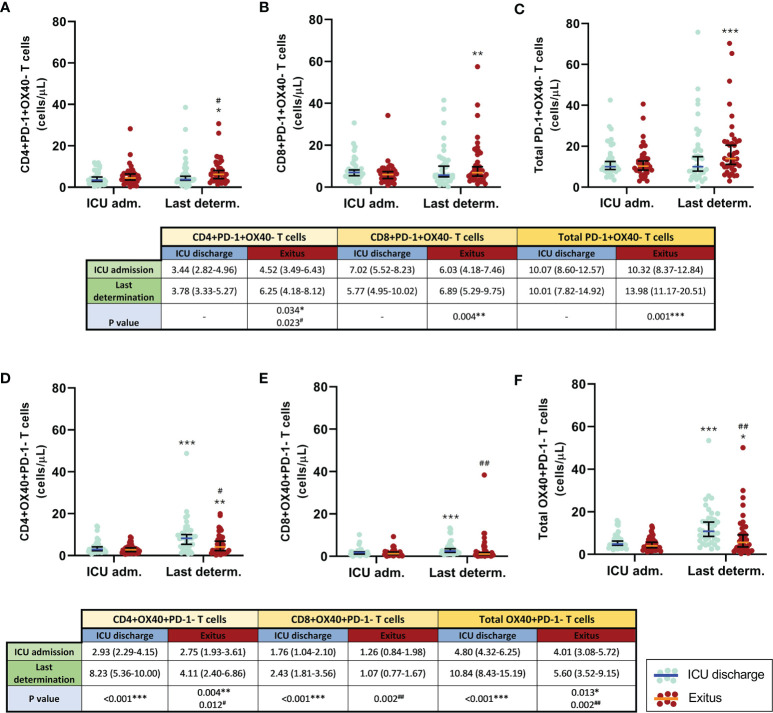
Figure 4.
Comparison of the circulating exhausted (PD-1+OX40−) and activated (OX40+PD-1−) T cells in discharged (blue) and deceased (red) coronavirus disease 2019 (COVID-19) patients between the first and the last determination in the ICU. (A) CD4+PD-1+OX40− T cells. (B) CD8+PD-1+OX40− T cells. (C) Total PD-1+OX40− T cells. (D) CD4+OX40+PD-1− T cells. (E) CD8+OX40+PD-1− T cells. (F) Total OX40+PD-1− T cells. All data shown are the median and 95% confidence intervals of cells per microliter. #p ≤ 0.05m, ##p ≤ 0.01 comparing opposite groups, respectively; *p ≤ 0.05, **p ≤ 0.01, ***p ≤ 0.001 compared with ICU admission, respectively.

