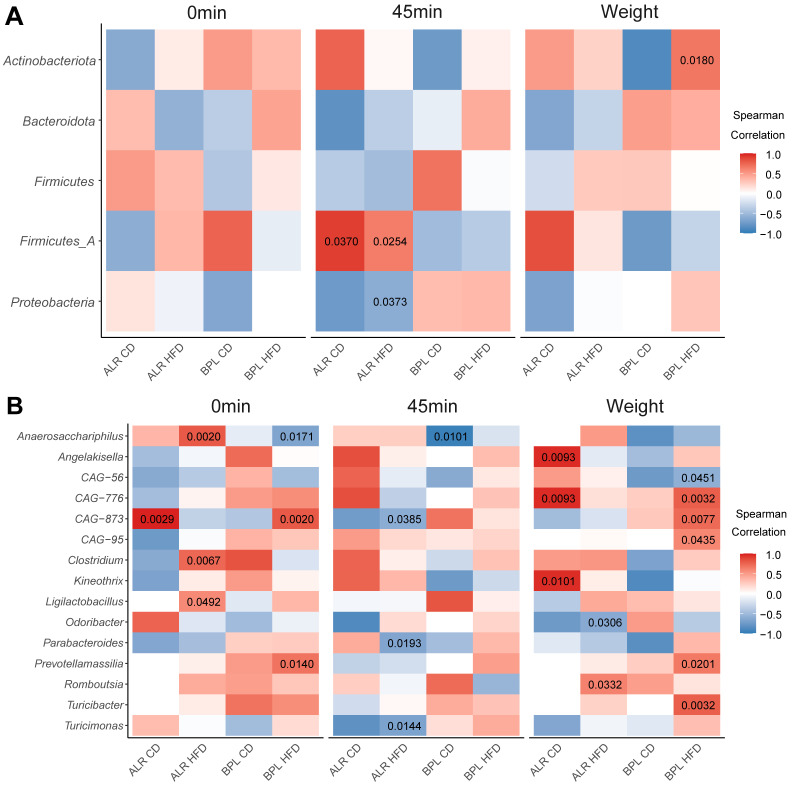
Figure 4.
Correlation of bacterial phylum and genus with metabolic parameters. (Panel A) shows the correlation with bacterial phyla and (Panel B) are those with a genus. Correlation of bacterial abundance with fasting glucose levels (0 min), that with area glucose levels at 45 min after glucose injection in ipGTT (45 min), and that with body weight (Weight). p-values smaller than 0.05 are presented in the heat maps; only genera were included where the p-value was below 0.05 in at least one comparison.

