. 2021 Dec 10;43(4):278–285. doi: 10.47626/2237-6089-2020-0078

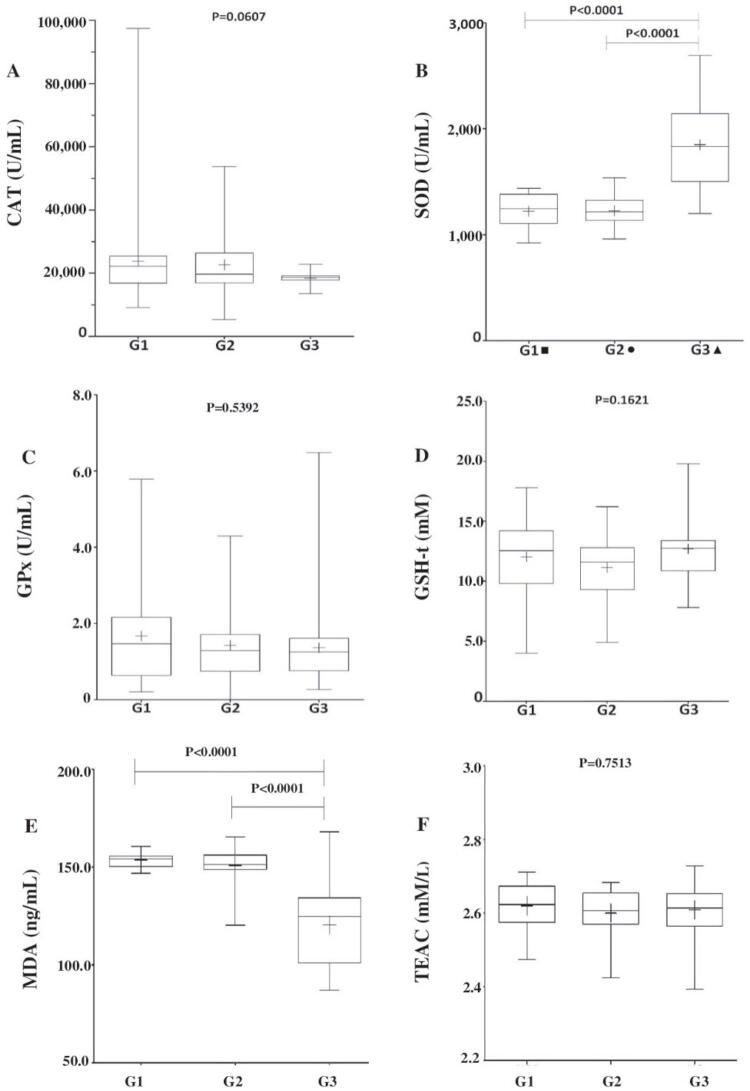
Figure 1. A) Catalase (CAT) values were similar in the patient groups and the control group (p = 0.0607); B) Lower superoxide dismutase (SOD) levels were found in the patient groups (G1 and G2) than in controls (G3; * p < 0.0001); C) Glutathione peroxidase (GPx) levels were similar between groups (p = 0.5392); D) total glutathione (GSH-t) levels were also similar between groups (p = 0.1621). E) Malondialdehyde (MDA) levels were higher in patients (G1 and G2) than in controls (G3; * p < 0.0001). F) Trolox-equivalent antioxidant capacity (TEAC) levels were similar between groups (p = 0.7513). + = mean; – = median; ■: number of treatment-responsive schizophrenia patients = 8; ●: number of treatment-resistant schizophrenia patients = 12; ▲: number of controls = 20; p = significance level according to the Kruskal-Wallis test or* to the Mann-Whitney test.

Figure 1