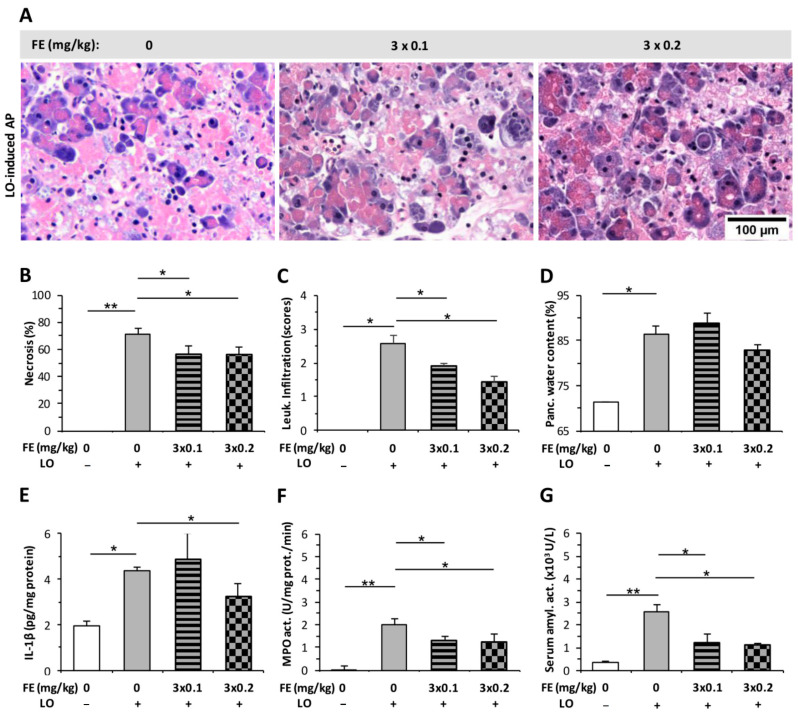
Figure 3.
Fentanyl (FE) treatment started after the induction of L-ornithine (LO) acute pancreatitis (AP) reduces disease severity. (A) Representative histopathological images of pancreatic tissues of the treatment groups. Bar charts show the extent of pancreatic (B) necrosis, (C) leukocyte infiltration, (D) water content, (E) interleukin-1β (IL-1β) concentration, (F) myeloperoxidase (MPO) activity, and (G) serum amylase activity measurements. Values represent mean with standard error, n = 10–18. Two-way ANOVA was performed followed by the Holm–Sidak post hoc test. * p < 0.05; ** p < 0.001.

