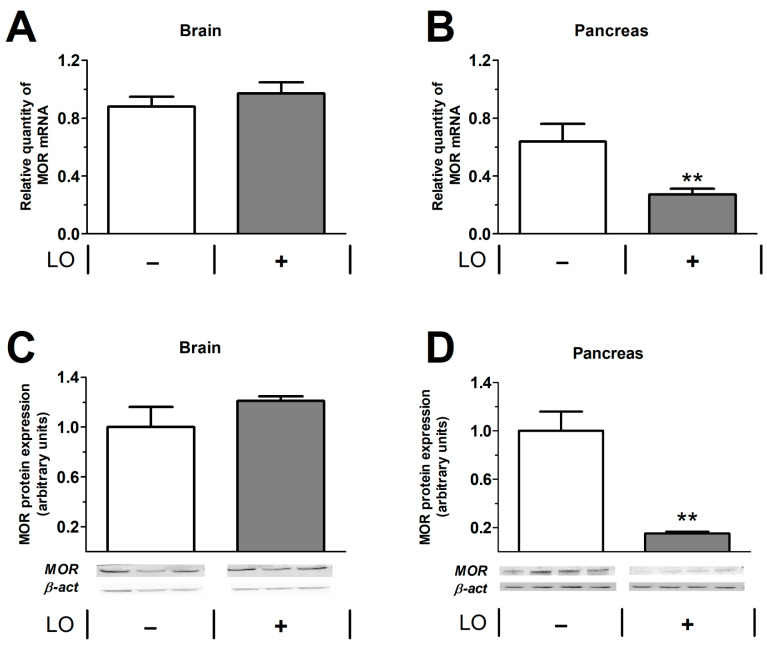
Figure 10.
Expression of mu opioid receptor (MOR) in the brain and pancreas in control and LO-induced AP. Rats were treated with vehicle or 3 g/kg LO-HCl and were sacrificed at 24 h. MOR mRNA (A,B) and protein (C,D) expression levels were determined in the brain (A,C) and pancreas (B,D). In (C,D), the bar charts show the quantitative analysis of Western blot images. Values represent mean with standard error, n = 13–17 (RT-PCR), n = 3–4 (Western blot analysis). Student’s t test was performed, ** p < 0.01. Abbreviations: LO, L-ornithine-induced acute pancreatitis; β-act, β-actin; MOR, mu opioid receptor.

