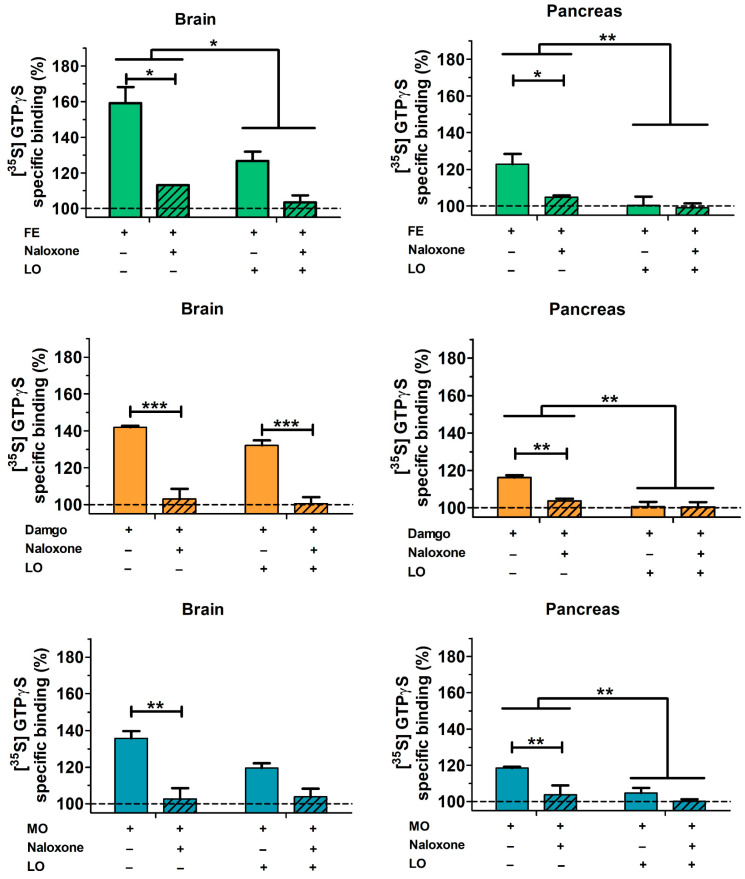
Figure 11.
Stimulation of G-protein activation in rat brain and pancreas membrane homogenates. Tissue samples were derived from control and AP animals. Treatments of pancreatic homogenates were as follows: 10 µM FE; 10 µM DAMGO; 10 µM MO. Striped bars represent the combined treatment with mu receptor ligands (FE, MO, DAMGO) and equimolar naloxone. Values represent mean with standard error, n = 6. Two-way ANOVA was performed followed by Bonferroni post hoc test. * p < 0.05, ** p < 0.01; *** p < 0.001.

