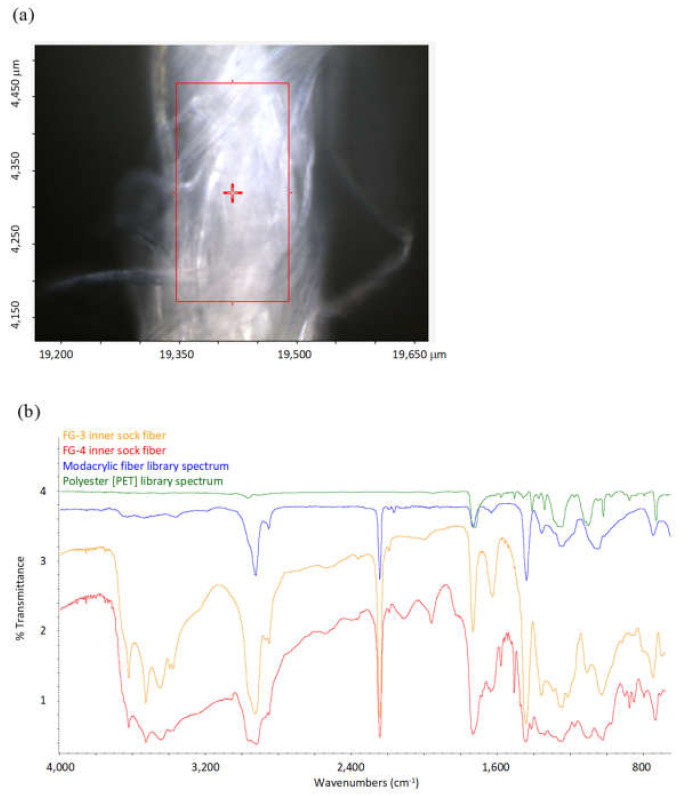
Figure 9.
(a) FTIR microscope image of analyzed area of 200 um thickness, synthetic fiber bundle from inner sock material in FG-4. (b) FTIR microspectroscopy results (red spectrum) from (a). Also shown is a spectrum from the inner sock of FG-3 (orange). Both are good matches with the library spectra for modacrylic fibers containing vinyl chloride and antimony trioxide additives (blue). In addition, the synthetic fibers from FG-3 contain minor peaks matching PET (green).

