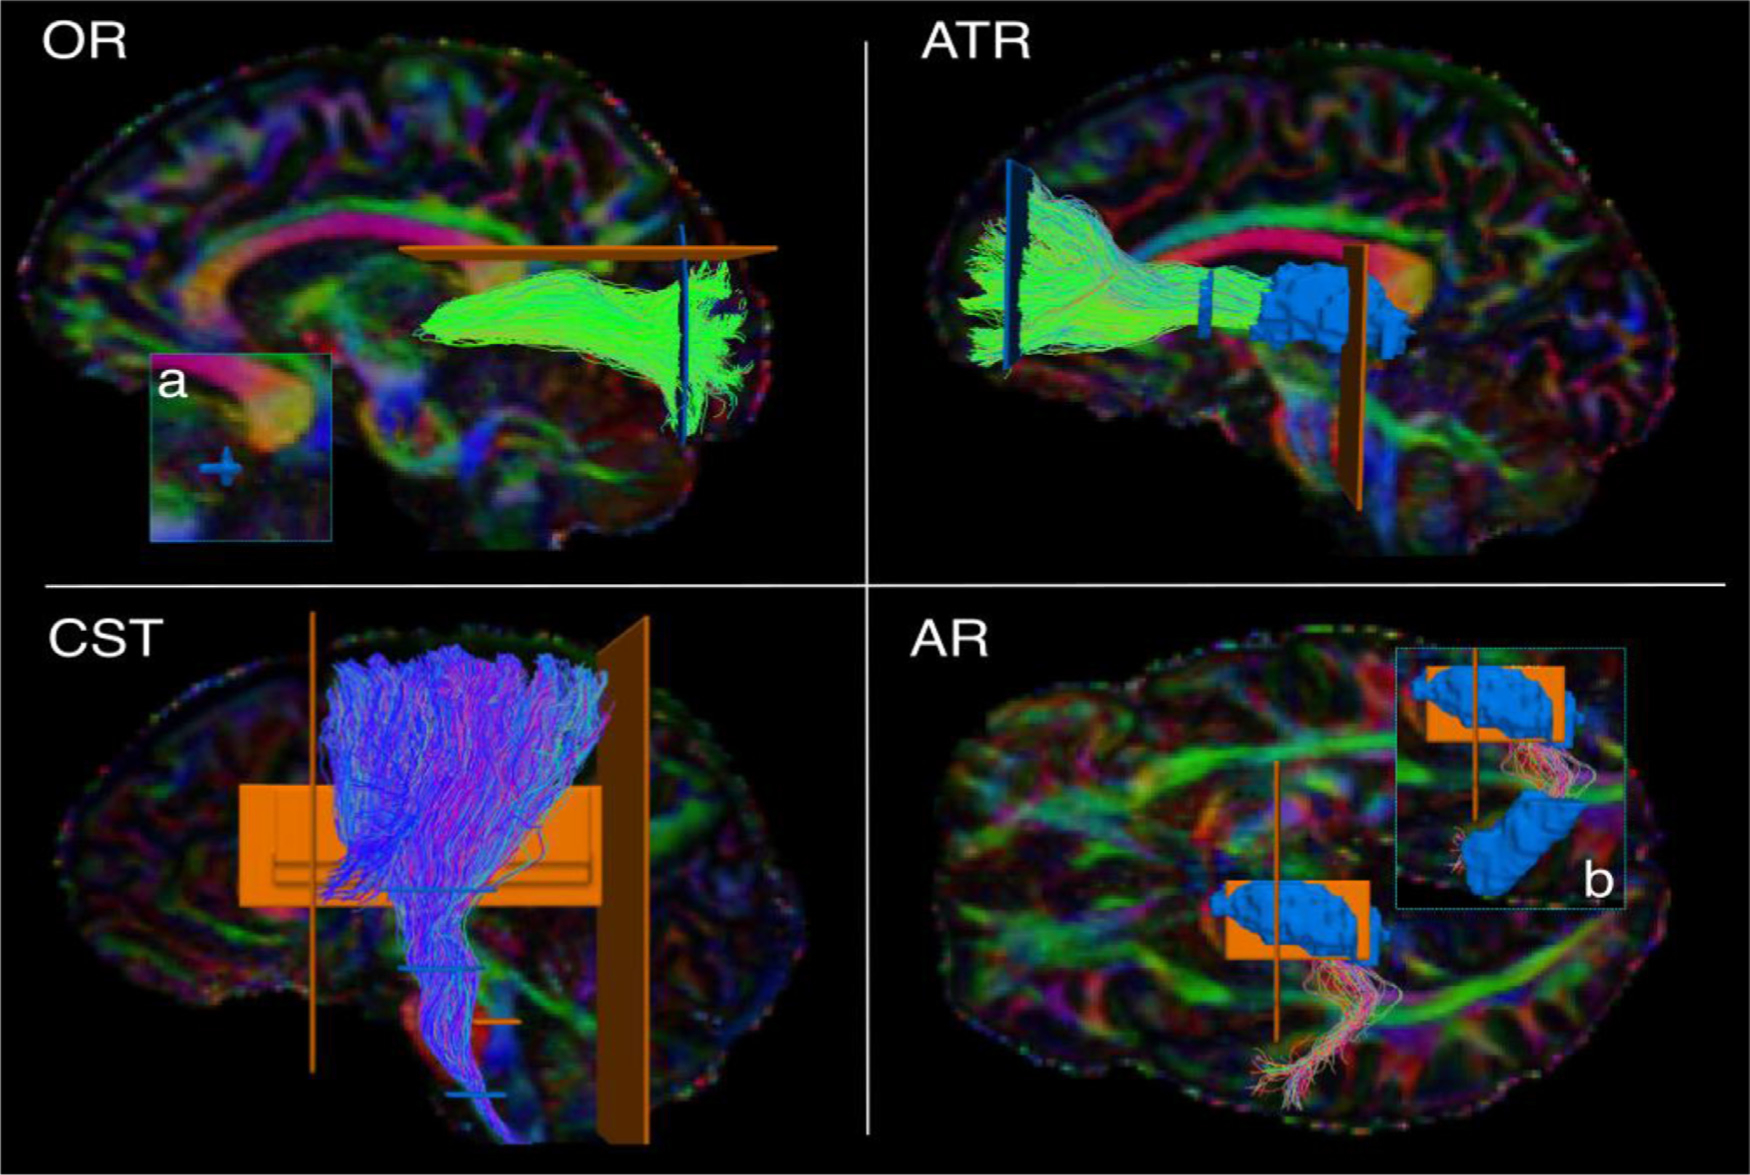
Fig. 2.

Manual labeling: projection pathways. The figure shows the manual labeling protocols for the projection pathways in one representative subject. Inclusion ROIs are shown in blue, exclusion ROIs in orange. Tracts are shown on color-coded FA maps. OR: optic radiation. ATR: anterior thalamic radiation. CST: cortico-spinal tract. AR: acoustic radiation. a) zoom-in showing ROI on the lateral geniculate nucleus of the thalamus. b) zoom-in showing ROI on Heschl’s gyrus.
