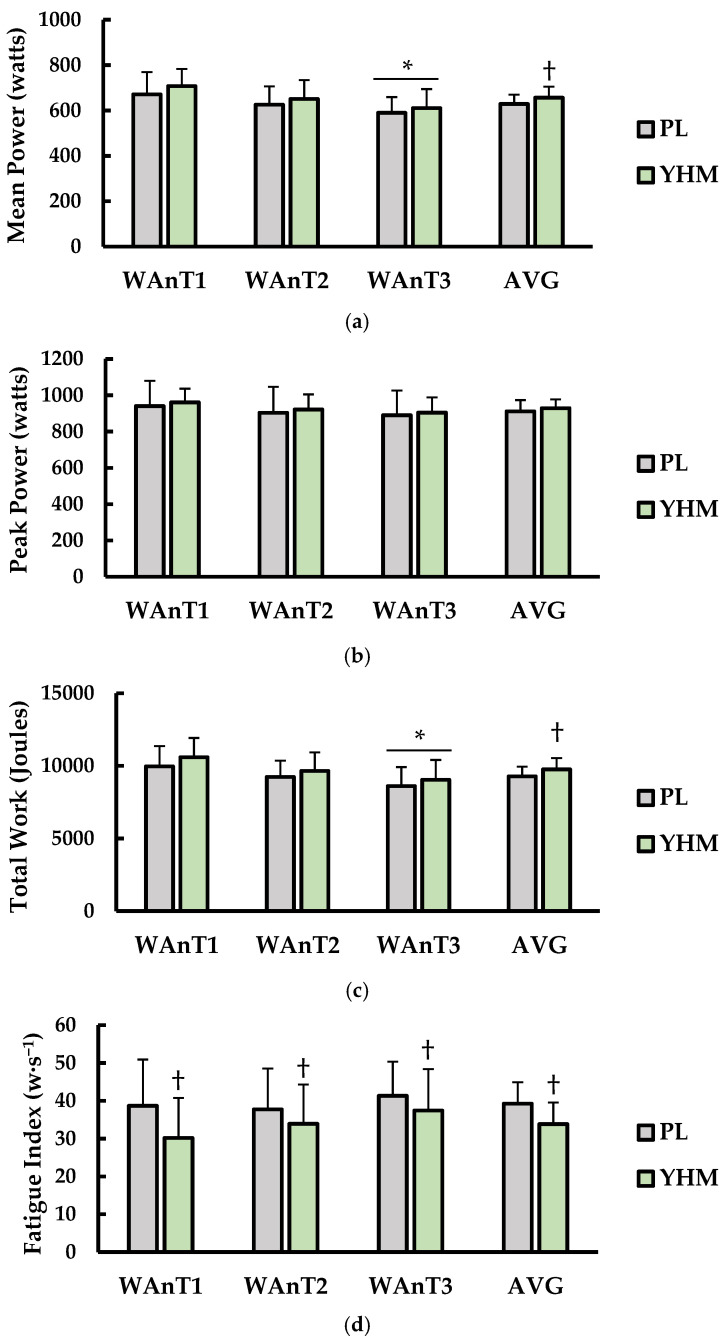
Figure 1.
(a) Mean power (watts), (b) peak power (watts), (c) total work (joules), and (d) fatigue index (watts/s) compared between placebo (PL; grey bars) and yohimbine (YHM; green bars). Data are shown as the mean ± SD. Measurements are shown for WAnT1, WAnT2, WAnT3, and the average of all three tests together (AVG) for each condition. * indicates significantly different from WAnT1 (p < 0.05). † indicates significantly different from PL (p < 0.05).

