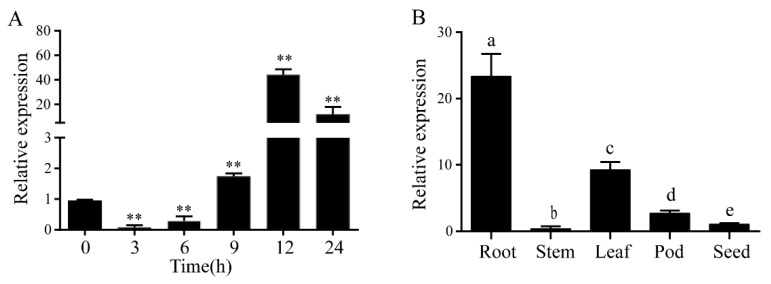
Figure 1.
Expression pattern of GmLecRlk. (A) Expression analysis of GmLecRlk in response to salt stress by qRT-PCR. Asterisks indicate a significant difference compared with the corresponding control (Student’s t test: ** p < 0.01). (B) Tissue specificity analysis of the GmLecRlk gene. A one-way ANOVA was used to generate the p values. Error bars represent standard deviations. Values represent the means of three biological replicates.

