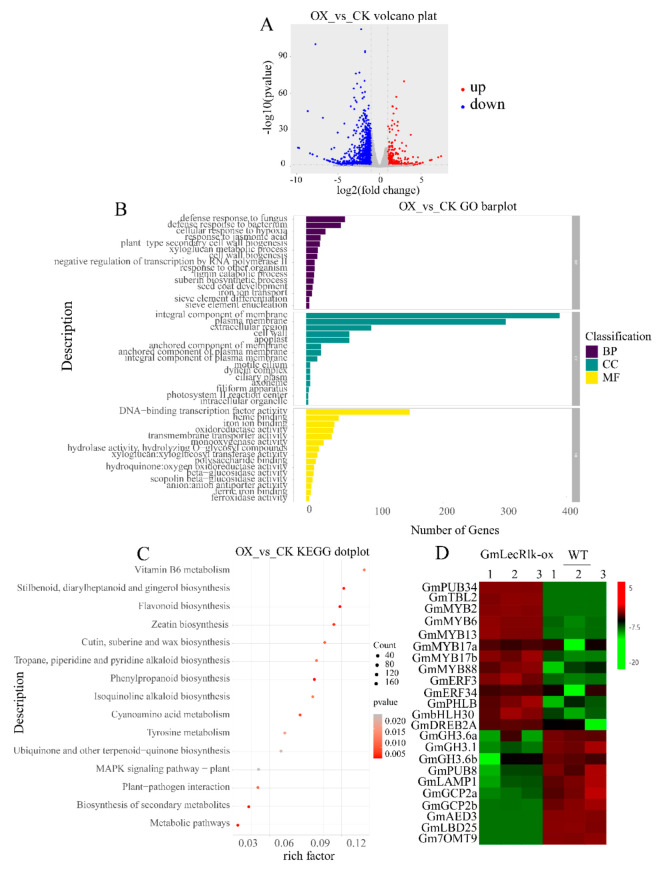
Figure 5.
Transcriptomic analysis of GmLecRlk-ox and WT soybean. (A) Number of genes showing differential expression in GmLecRlk-ox and WT; (B) GO terms that were statistically enriched in differentially expressed genes in GmLecRlk-ox and WT; (C) KEGG enrichment analysis of differentially expressed genes in GmLecRlk-ox and WT plants; (D) The heat map of differential expression in GmLecRlk-ox and WT soybean. The numerical values for the green-to-red gradient bar represent the log2-fold change relative to the control sample.

