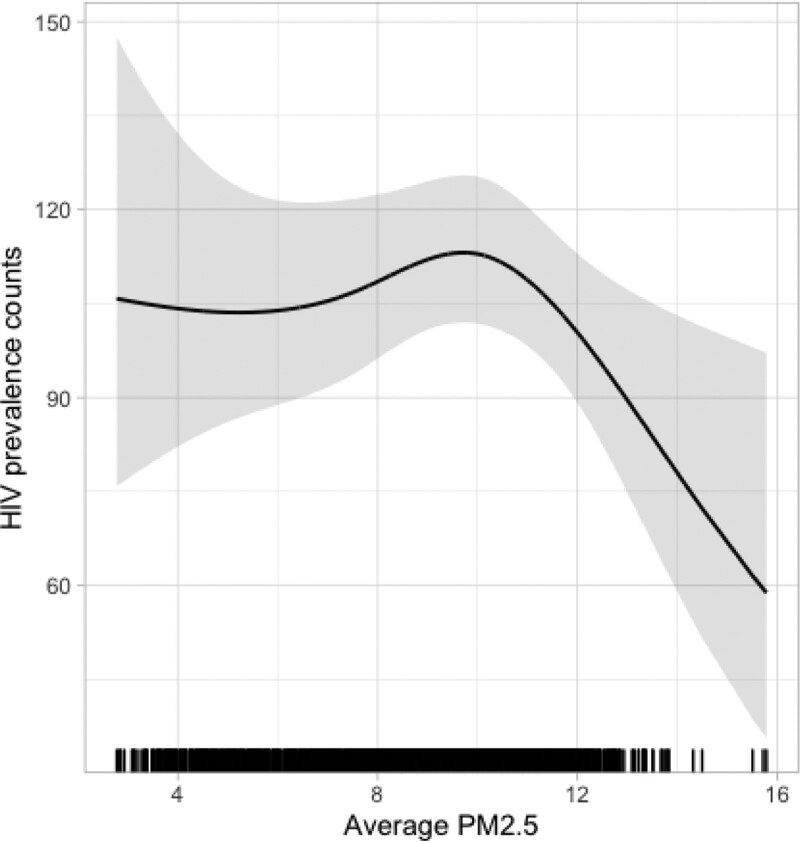
Figure 2.
Adjusted exposure-response curves for PM2.5 and the prevalence of HIV in 2018 (solid lines) and 95% CIs (shaded areas) using natural cubic spline models with 3 df, for three different time periods Adjusted, using natural cubic spline functions, for county-level measures of smoking, population density, older population, hospital beds, median household income, poverty, summer temperature, mean body mass index, percentage of population that is White, Hispanic, Asian, White, Black, and proportion of fully vaccinated persons added to model.

