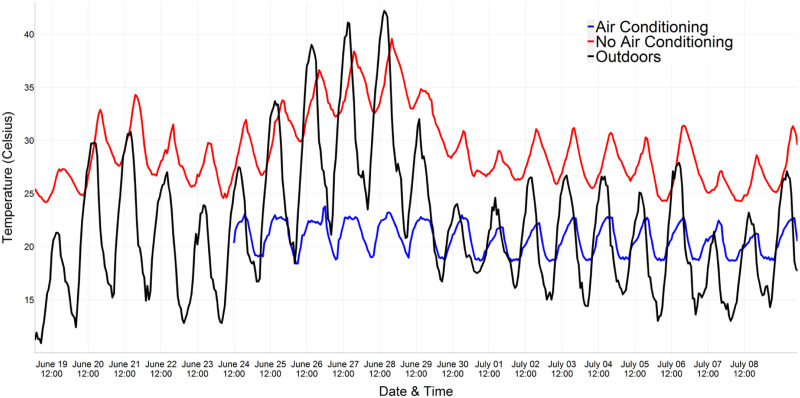
Figure 2.
Hourly temperature measurements during the 2021 heat dome in greater Vancouver. These data come from the inland municipality of Abbotsford, where temperatures are usually at least 5°C higher than in the coastal areas. The outdoor measurements (black line) were taken from the weather station at Abbotsford International Airport. The indoor measurements (blue and red lines) were accessed through the ecobee Donate Your Data program (https://www.ecobee.com/donate-your-data/), which allows its internet-enabled thermostat owners to make their data anonymously available for research purposes. There were 11 homes with ecobee data in Abbotsford. The red line shows the worst-case scenario home without air conditioning, demonstrating how temperatures can build to dangerously high levels during an extreme heat event. The blue line shows the best-case scenario home with air conditioning, though data were missing for the days before the heat dome.

