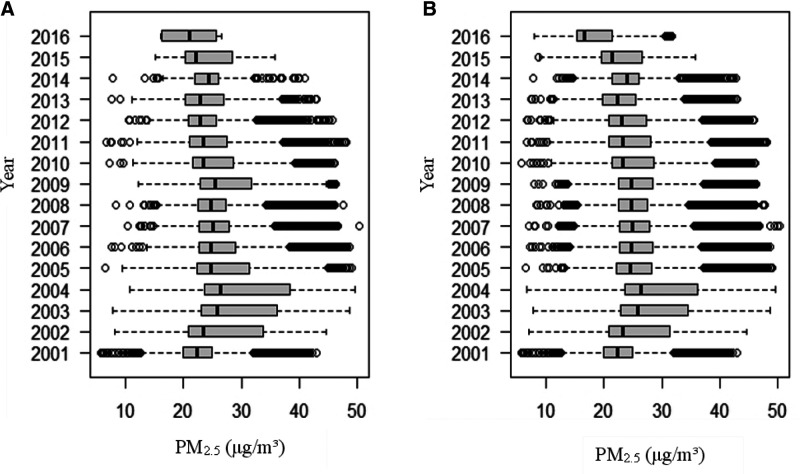
Figure 2.
The temporal distribution of the 2-year average of PM2.5 concentration by year in Taiwan. (A, B) represent the temporal distributions of the 2-year average PM2.5 concentrations by year. Boxes cover the 25th–75th percentiles (IQR) with center lines indicating the median concentration. Whiskers extend to the highest observed concentrations within the three IQRs of the box, with more extreme observations shown as circles. Panel A illustrates the distribution of baseline PM2.5 concentrations from 121,948 participants. (B) shows the distribution of PM2.5 exposure of 407,821 medical visits from the 121,948 participants. IQR, interquartile range.

