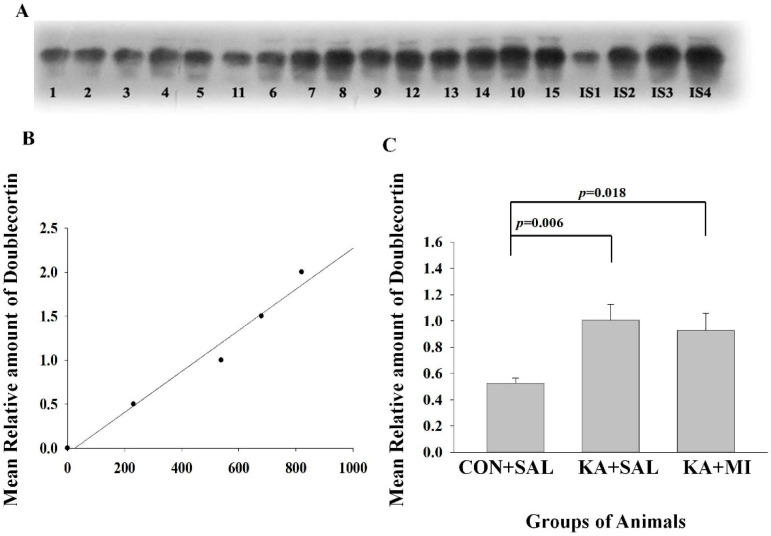
Figure 7.
Hippocampus, Doublecortin levels are increased both in KA + SAL and KA + MI groups. (A) Sample film, where each lane corresponds to one sample. Lanes 1–5 are from CON + SAL group; lanes 6–10 from KA + SAL group and lanes 11–15 from KA + MI group. Lanes IS-1-IS4 internal standards containing, respectively, 15, 30, 45, and 60 μg protein. (B) Calibration plot (lines fitted by linear least-squares regression); (C) Mean levels of Doublecortin (mean ± sem) The details of statistical analysis are provided in the manuscript.

