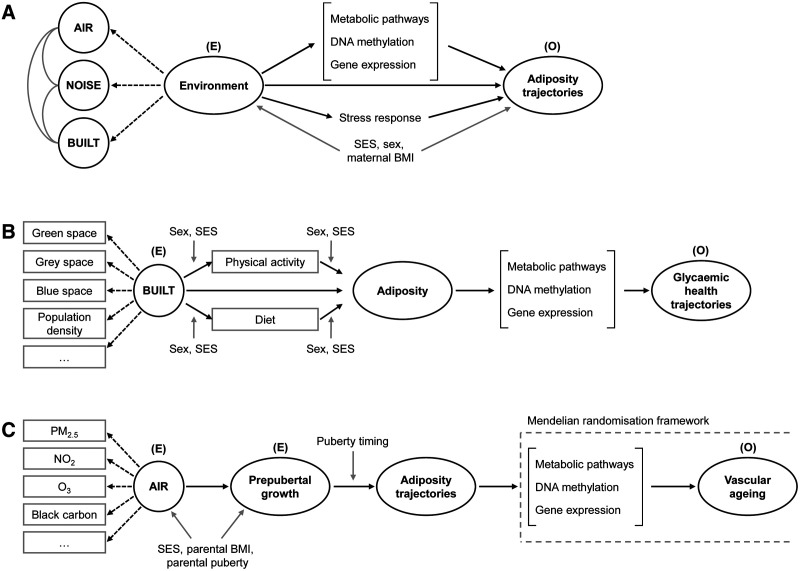
Figure 1.
Possible pathways from environment to health outcomes. Directed acyclic graphs representing possible pathways from environmental exposures to adiposity trajectories (A), built environment to glycemic health trajectories (B) and air pollution to vascular aging via growth and adiposity trajectories (C). Black arrows indicate potential causal links, gray arrows indicate confounding paths, and dashed arrows indicate noncausal, latent class paths. AIR indicates air pollution; BMI, body mass index; BUILT, built environment; E, exposure; NOISE, environmental noise; O, outcome; SES, socioeconomic status.

