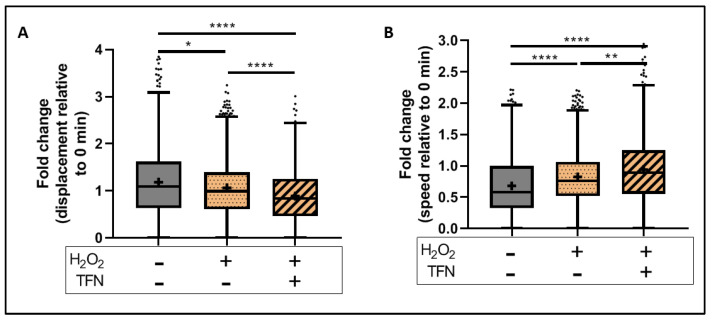
Figure 4.
Mitochondrial motility in brain slices exposed to oxidative stress with the presence/absence of TFN: Fold change in (A) mitochondrial displacement and (B) motility speed with respect to 0 min slice. Graphs are expressed as fold change with respect to the baseline and shown in Tukey boxplots. Inside the box, ‘+’ delineates the mean. ‘−’ horizontally aligned with H2O2 and TFN denotes no H2O2 or TFN treatment. * p ≤ 0.05, ** p ≤ 0.01, and **** p ≤ 0.0001.

