
Fig. 2.
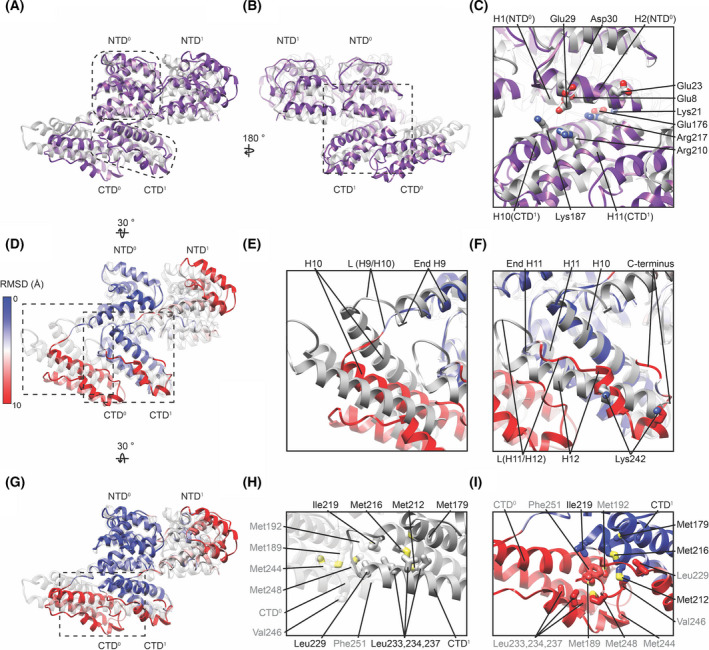
Structural similarities and differences between linear M1 oligomers from two different M1 in vitro arrays. (A) Overlay of two neighbouring M1 monomers as they occur in the nucleic acid scaffolded M1 array (grey, PDB‐6Z5L) and in the M1 array from V97K formed under high‐salt conditions (purple, PDB‐7JM3). The overlay was generated by aligning the NTD0 from both structures. (B) As (A) but rotated by 180°. The dashed outline in (A) marks the stable unit between both structures, formed by NTD0 and CTD1 from the neighbouring monomer to which it is directly bound. This unit is similar between both structures. (C) A magnified view of the interface between NTD and the neighbouring CTD indicating the presence of several charged sidechains. (D). Overlay of the two structures similar to (A) but in which the root mean squared difference (RMSD) between the two structures has been calculated and is indicated by the colour of the high‐salt assembled M1 model. This highlights the similarity between the two structures within the stable unit (blue). (E) Magnified view of the residues connecting the NTD and CTD of M1 within one monomer, where the linker L(H9/H10) is more extended in the high‐salt V97K structure (coloured by RMSD) relative to the nucleic acid scaffolded structures (grey). This leads to a change in the relative position of the CTD resulting in a higher RMSD (red). (F) Magnified view of the CTD region highlighting differences between the in vitro structures in H12 and the linker connecting H11 and H12. (G) As in (D) but turned by 30° to highlight interactions between CTDs of neighbouring monomers. (H) Positions of hydrophobic side chains at the interface between neighbouring CTDs in the nucleic acid scaffolded M1 array. Side chain names in grey and black are positioned on CTD0 and CTD1, respectively. (I) Positions of the same side chains shown in h marked in the high‐salt V97K structure.