Fig. 4.

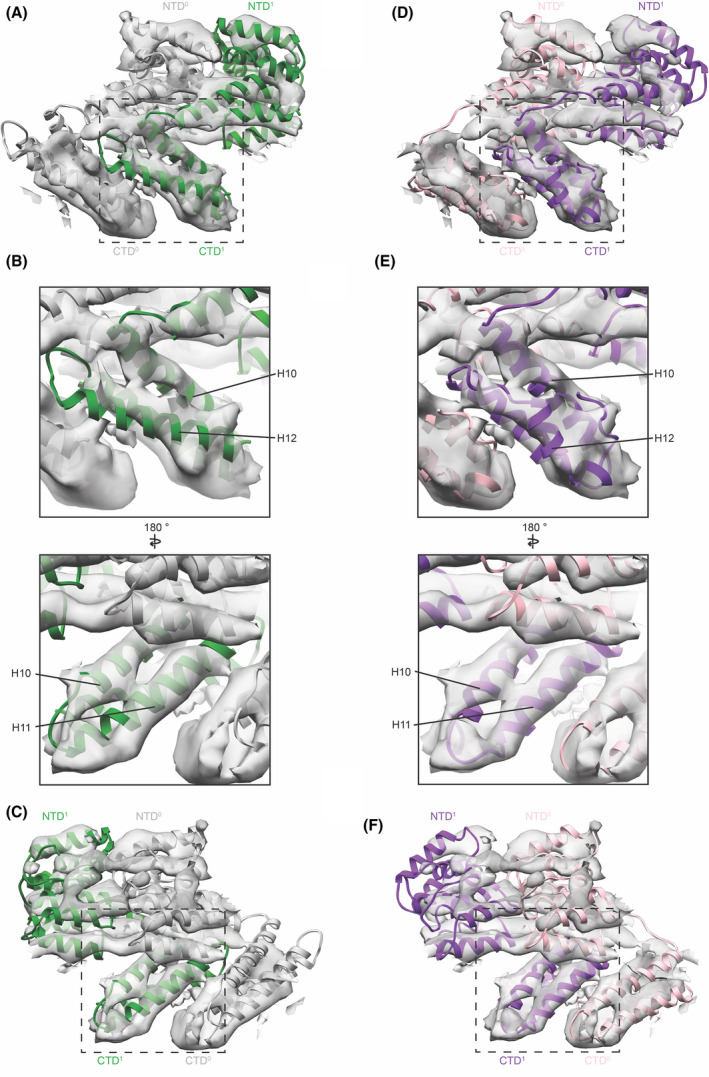
Comparison of M1 in vitro models to the arrangement of M1 within viruses/VLPs. (A) Two neighbouring monomers from the nucleic acid scaffolded M1 (green/grey ribbons, PDB‐6Z5L) are fitted into the structure of M1 determined in situ (grey isosurface, EMD‐11078). (B) Magnified views of CTD1 focusing on the region of H12, which is different between the two in vitro structures, indicating that H12 in the model is longer and rotated slightly relative to the density (left), while H10 and H11 fit the density well (right). (C) Same as (A) but rotated by 180° indicating the slight offset between model and density for CTD0 and NTD1 while the stable unit (NTD0 and CTD1) fits well. (D) Two neighbouring monomers from the V97K high‐salt M1 assembly (pink/purple ribbons, PDB‐7JM3) fitted into the M1 in situ structure. (E) Magnified views indicating that helix 12 and L(H11/H12) as well as H10 and H11 fit the density well. (F) Same as (D) but rotated by 180° indicating the slight offset between model and density for CTD0 and NTD1, while the stable unit (NTD0 and CTD1) fits well.
