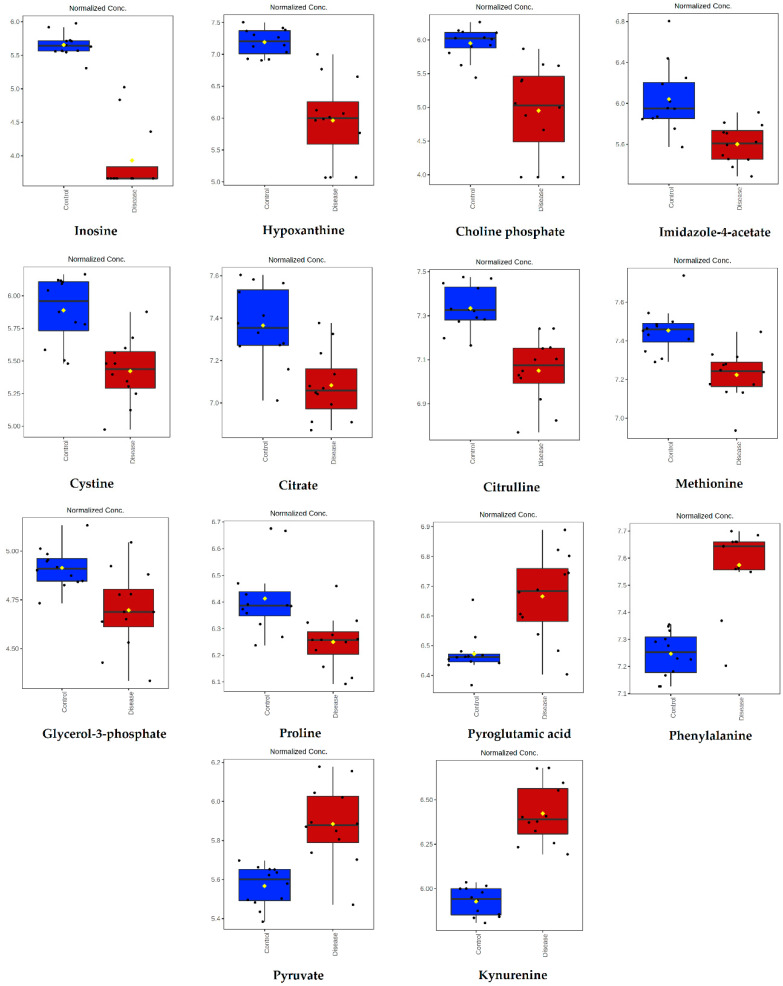
Figure 2.
Intensity of metabolites significantly altered in dogs infected with B. canis and analyzed by the untargeted LC-MS metabolomics approach. Data are presented as box and whiskers plot (mean ± SD). All metabolites shown demonstrated a statistically significant difference between groups by t-test (p < 0.05). Blue-control samples, red-disease samples.

