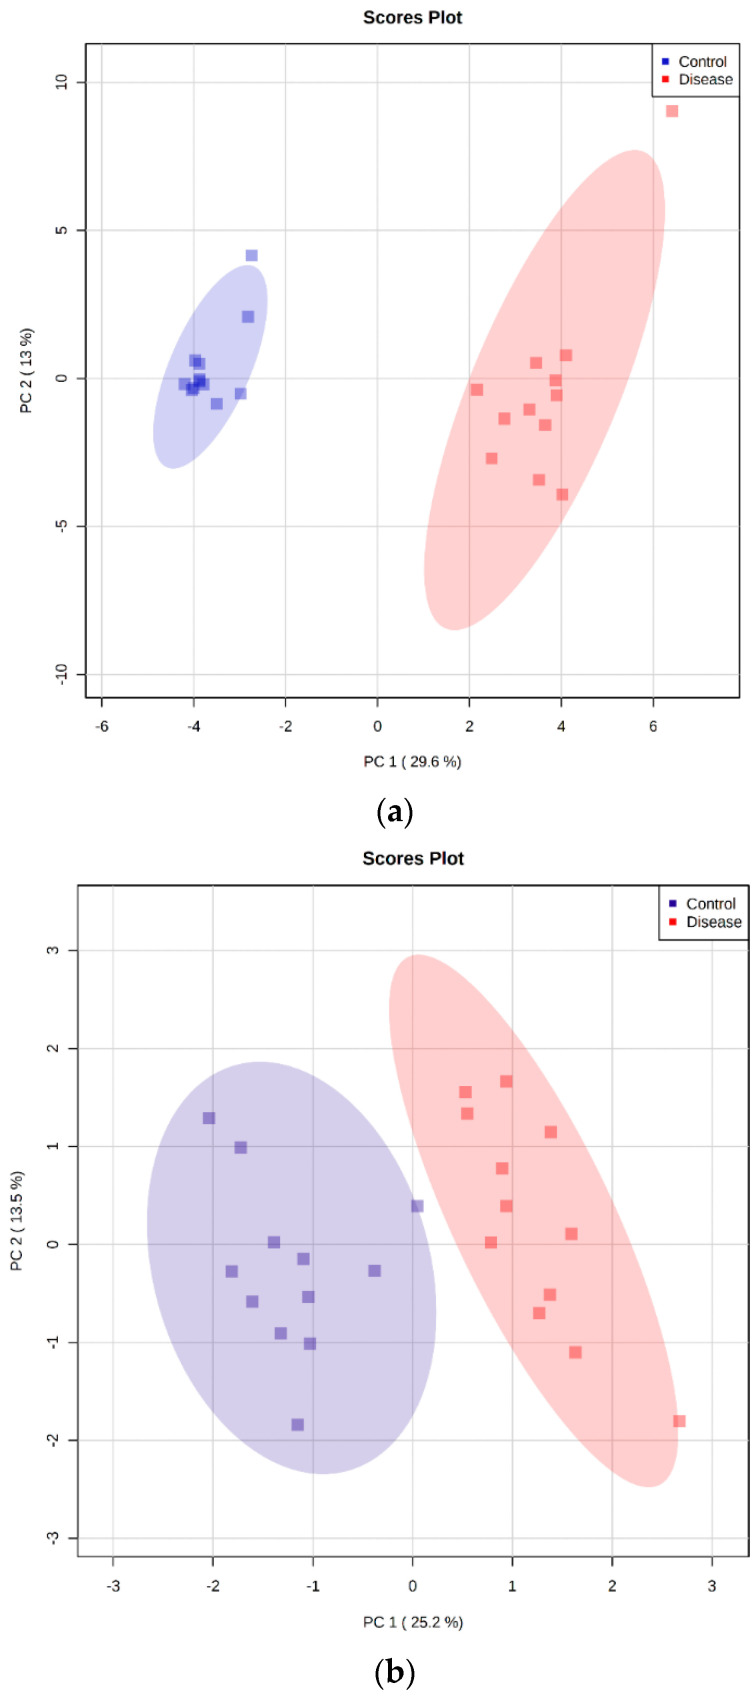
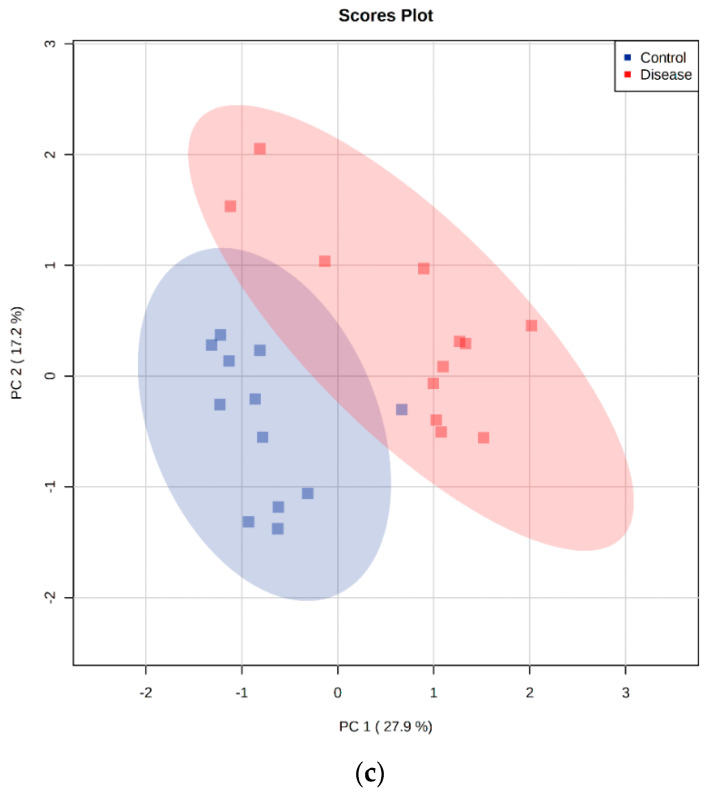
Figure 5.
Principal component analysis (PCA) score plots were performed using 24 serum samples of dogs by untargeted LC-MS metabolomics analysis (a), targeted LC-MS metabolomics analysis (b), and GC-MS metabolomics analysis (c). The first two principal components (PCs) explained 426% for the untargeted LC-MS metabolomics, 387% for the targeted LC-MS metabolomics, and 451% of the total variance for the GC-MS metabolomics.


