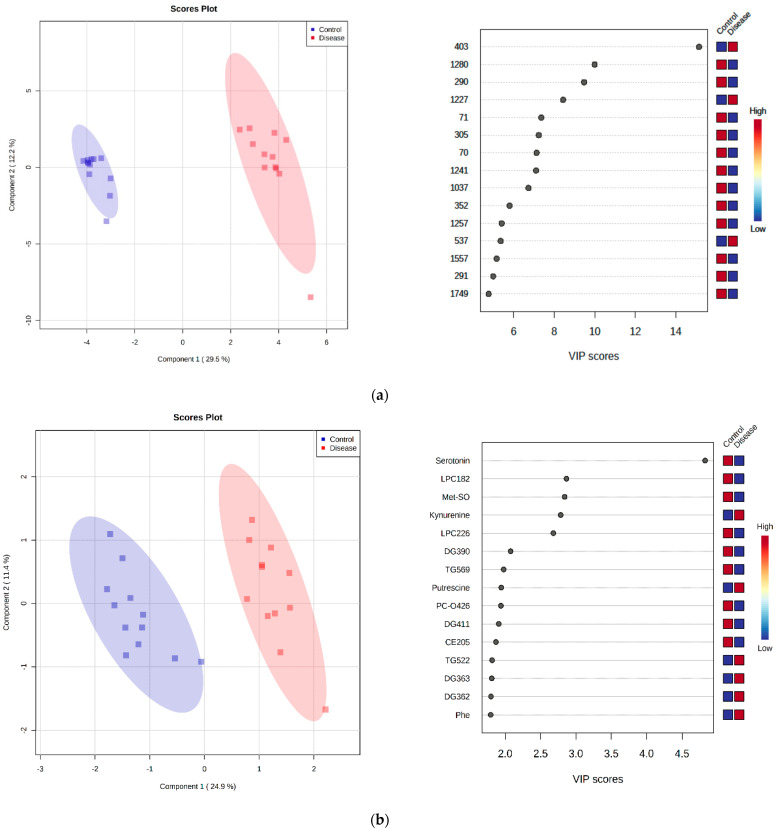
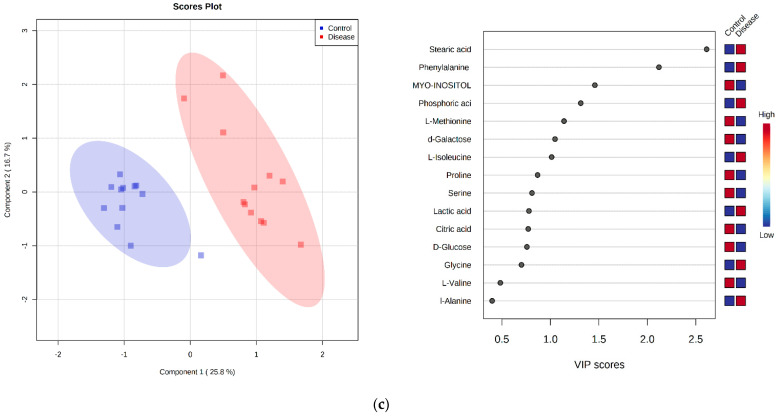
Figure 7.
Partial least squares-discriminant analysis (PLS-DA) score plots were performed in 24 analyzed serum samples from control group and group of dogs infected with B. canis by untargeted LC-MS metabolomics analysis (a), targeted LC-MS metabolomics analysis (b), and GC-MS metabolomics analysis (c) (left panels). The list of the 15 important compounds/metabolites was identified by PLS-DA according to the variable importance on projection (VIP) score (right panels). The intensity of the colored boxes on the right represents the relative abundance of the corresponding metabolite in each group (blue-control, red-disease).


