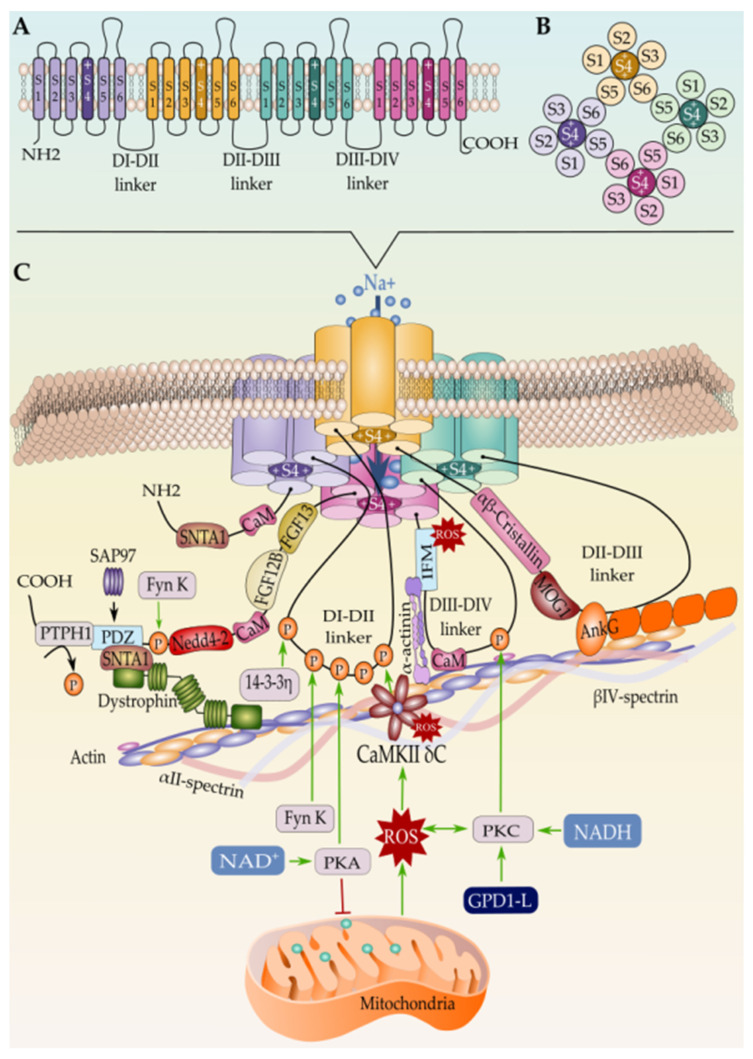
Figure 3.
(A) Schematic representation of the Nav1.5 secondary structure, (B) the intracellular view of the channel, and (C) the tertiary structure along with the interacting proteins. Only proteins with known binding sites in Nav1.5 are represented here. Mechanism of Nav1.5 regulation by the mitochondrial reactive oxygen species ROS is represented as well.

