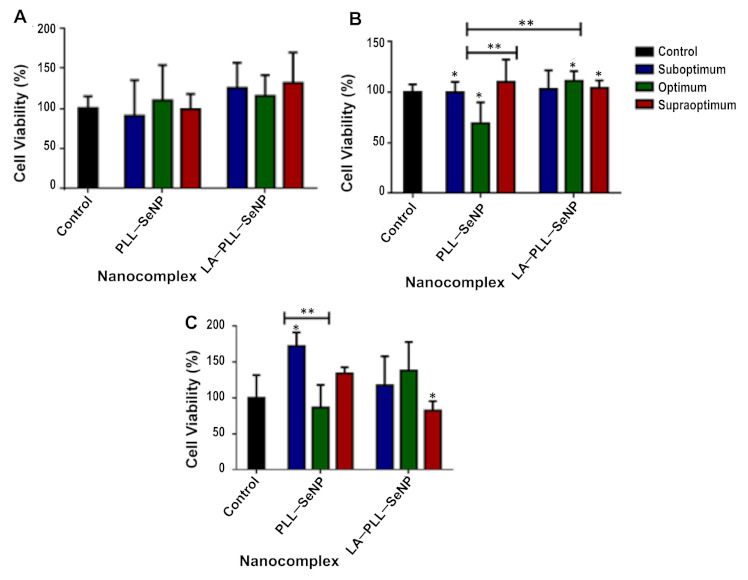
Figure 6.

Cytotoxicity profiles of the FSeNP nanocomplexes in (A) HEK293, (B) HeLa and (C) HepG2 cell lines. The control represents untreated cells and 100% cell viability. Data are represented as mean ± SD (n = 3). * p < 0.05 and ** p < 0.01 show statistical significance within each nanocomplex and between ratios of both nanocomplexes (untargeted vs. targeted).
