Figure 1.
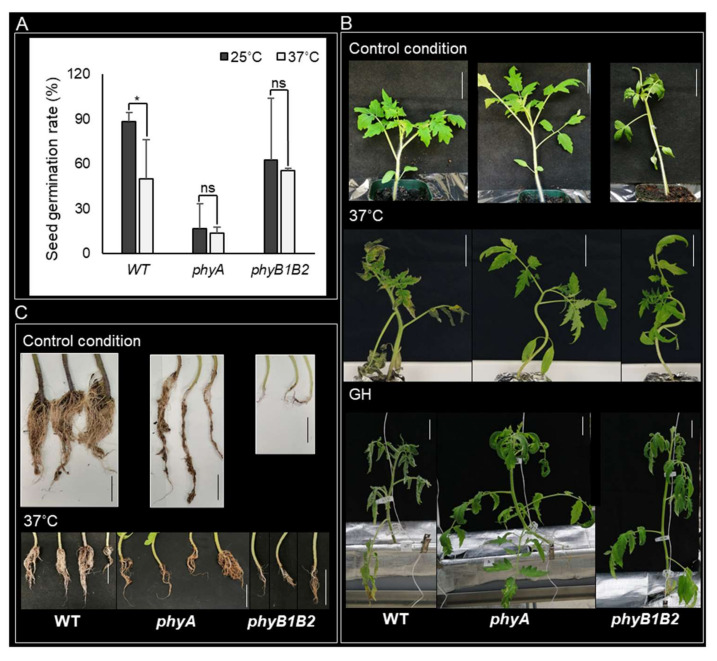
Plant features during seed germination and vegetative growth stages under heat stress (HS). (A) The seed germination rate of WT, phyA, and phyB1B2 after 7 days at 25 or 37 °C. (B) The phenotype of 4-week-old plants of tomato WT and phyA and phyB1B2 mutants under control conditions at 25 °C and after exposure to HS at 37 °C or fluctuating high temperature in greenhouse (GH) conditions for 2 weeks. (C) Root phenotype of 4-week-old plants of WT and phyA and phyB1B2 mutants after 2 weeks under control conditions at 25 °C or HS at 37 °C. The scale bars represent 5 cm. Values represent the means ± SD (n ≥ 10) from a representative of three biological replicates. The asterisk symbol (*) represents statistically significant differences (p < 0.05), while ns represents statistically nonsignificant differences, between each genotype individually under 25 and 37 °C according to one-way ANOVA with post hoc Tukey HSD test.

