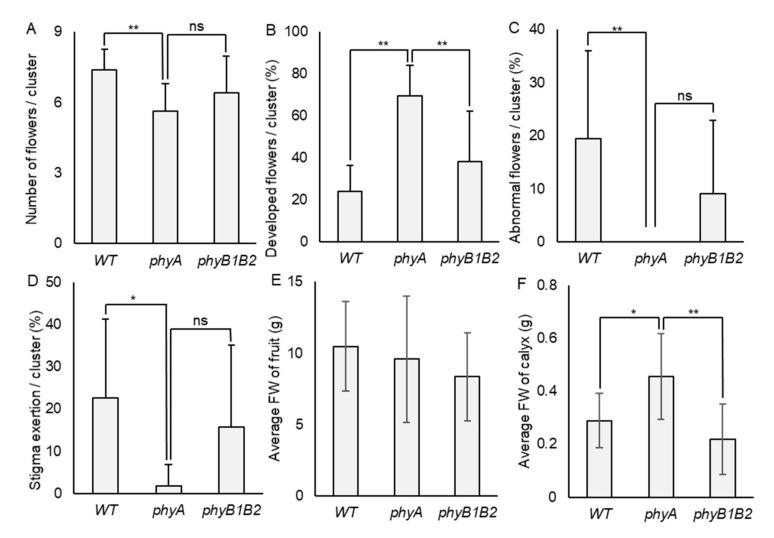
Figure 4.
Flower and fruit characteristics under heat stress (HS). (A) The number of flowers/cluster, (B) the percentage of developed flowers/cluster, (C) the percentage of abnormal flowers/cluster (that showed antheridia cone splitting), and (D) the percentage of stigma exertion/cluster were detected in WT, phyA, and phyB1B2 plants exposed to fluctuating high temperature for 14 days during flowering stage. (E) The average FW of fruit and (F) the average FW of calyx of WT, phyA, and phyB1B2 were recorded under greenhouse (GH) conditions. The average temperature is recorded in Figure S1. The minimum Tm was 17.0 °C while the maximum was 50.5 °C. Data represent the means ± SD (n ≥ 8). The asterisk symbol (*) represents statistically significant differences (p < 0.05), double asterisk symbol (**) expresses statistically highly significant differences (p < 0.01), and ns abbreviation represents statistically nonsignificant differences between all genotypes under HS conditions according to one-way ANOVA with post hoc Tukey HSD test.

