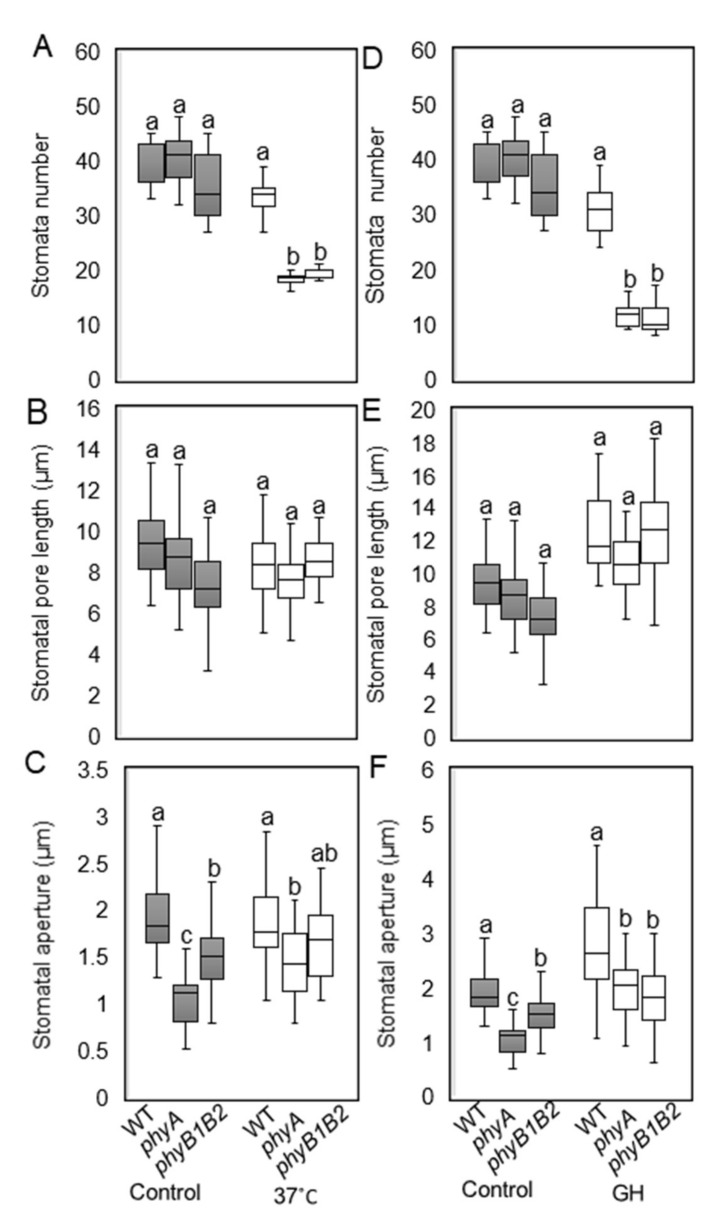
Figure 6.
Microscopic analysis of stomata features under heat stress (HS). Stomata number/92.7mm2 (A,D), stomatal pore length (μm) (B,E), and stomatal aperture (μm) (C,F) after 2 weeks under HS at 37 °C and greenhouse (GH) conditions were investigated in comparison with control conditions at 25 °C. The boxplot values represent the recorded data (n ≥ 10) from a representative of three biologically independent experiments. The letters written on the top of the boxplots show the statistically significant differences between WT and phy mutants under control and HS conditions individually according to Duncan’s test (p < 0.05). The same letter indicates no significant difference.

