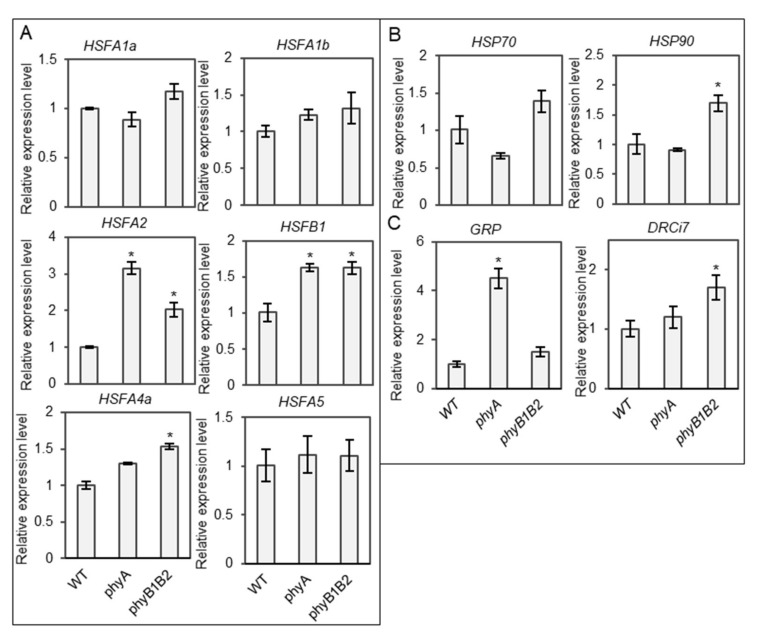
Figure 8.
Relative gene expression levels under heat stress (HS) during vegetative growth stage. The expression levels of HSFs (HSFA1a, HSFA1b, HSFA2, HSFB1, HSFA4a, and HSFA5) (A), HSPs (HSP70 and HSP90) (B), and stress-responsive genes (GRP and DRCi7) (C) of one-month-old plants of WT and phyA and phyB1B2 mutants after 2 weeks under HS at 37 °C. The relative expression level of the WT was normalized to 1. Error bars represent standard deviation (n = 3). The asterisk symbol (*) represents statistically significant differences between WT and phy mutants using Duncan’s test (p < 0.05).

