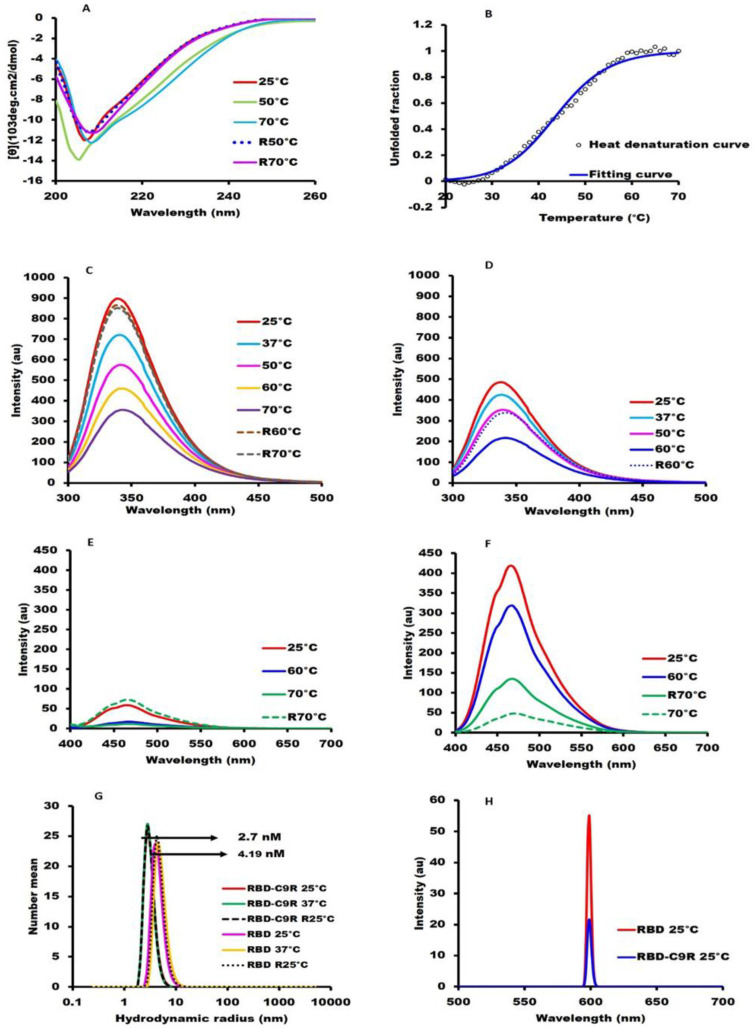
Figure 2.
Biophysical and spectroscopic characterization: All spectroscopic measurements were performed at a protein concentration of 0.3 mg/mL in 10mM Hepes buffer, pH 8.0. (A) Far-UV CD spectrum of RBD-C9R (200–260 nm). (B) The melting temperature (Tm) of RBD-C9R monitored by CD at 220 nm, the raw data are shown with open circles (ο). (C) Tryptophan fluorescence spectra of RBD-C9R, (D) Tryptophan fluorescence spectra of RBD. (E) ANS fluorescence spectra of RBD-C9R, (F) ANS fluorescence spectra of RBD, (G) Dynamic Light Scattering, and (H) Static Light Scattering. Line symbols are explained within the panels.

